CorningIncorporated GLW full analysis,charts,indicators,moving averages,SMA,DMA,EMA,ADX,MACD,RSICorning Incorporated GLW WideScreen charts, DMA,SMA,EMA technical analysis, forecast prediction, by indicators ADX,MACD,RSI,CCI NYSE stock exchange
operates under Basic Industries sector & deals in Telecommunications Equipment
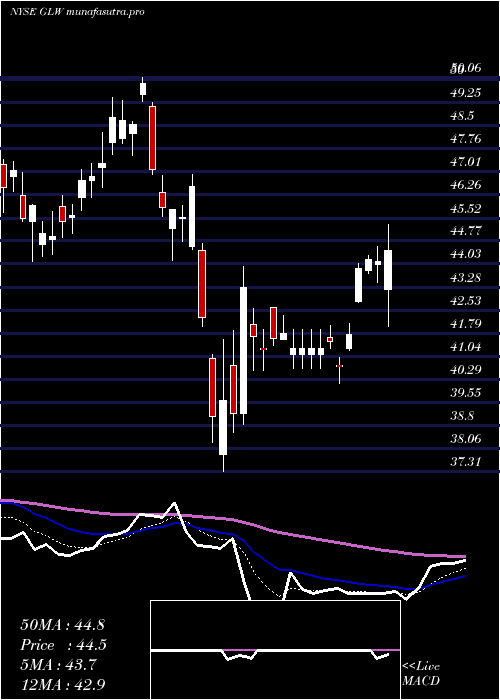
Daily price and charts and targets CorningIncorporated Strong Daily Stock price targets for CorningIncorporated GLW are 84.31 and 88.46 | Daily Target 1 | 81.15 | | Daily Target 2 | 83.31 | | Daily Target 3 | 85.3 | | Daily Target 4 | 87.46 | | Daily Target 5 | 89.45 |
Daily price and volume Corning Incorporated
| Date |
Closing |
Open |
Range |
Volume |
Thu 04 December 2025 |
85.47 (2.3%) |
83.90 |
83.14 - 87.29 |
1.034 times |
Wed 03 December 2025 |
83.55 (-0.19%) |
83.12 |
81.67 - 84.06 |
1.1068 times |
Tue 02 December 2025 |
83.71 (0.98%) |
84.02 |
83.22 - 85.45 |
1.0993 times |
Mon 01 December 2025 |
82.90 (-1.54%) |
83.35 |
82.55 - 83.49 |
0.8505 times |
Fri 28 November 2025 |
84.20 (0.69%) |
83.96 |
83.53 - 84.34 |
0.4363 times |
Wed 26 November 2025 |
83.62 (0.82%) |
83.52 |
82.82 - 84.35 |
0.3924 times |
Tue 25 November 2025 |
82.94 (0.42%) |
82.68 |
80.27 - 83.34 |
0.5892 times |
Mon 24 November 2025 |
82.59 (3.94%) |
79.75 |
79.75 - 82.75 |
0.8616 times |
Fri 21 November 2025 |
79.46 (1.83%) |
78.56 |
77.39 - 80.06 |
1.6619 times |
Thu 20 November 2025 |
78.03 (-4.48%) |
84.25 |
77.49 - 84.59 |
1.9679 times |
Wed 19 November 2025 |
81.69 (1.96%) |
80.25 |
80.01 - 82.83 |
1.2784 times |
Weekly price and charts CorningIncorporated Strong weekly Stock price targets for CorningIncorporated GLW are 83.57 and 89.19 | Weekly Target 1 | 79.19 | | Weekly Target 2 | 82.33 | | Weekly Target 3 | 84.81 | | Weekly Target 4 | 87.95 | | Weekly Target 5 | 90.43 |
Weekly price and volumes for Corning Incorporated
| Date |
Closing |
Open |
Range |
Volume |
Thu 04 December 2025 |
85.47 (1.51%) |
83.35 |
81.67 - 87.29 |
0.727 times |
Fri 28 November 2025 |
84.20 (5.97%) |
79.75 |
79.75 - 84.35 |
0.4052 times |
Fri 21 November 2025 |
79.46 (-3.17%) |
81.61 |
77.39 - 84.59 |
1.4658 times |
Fri 14 November 2025 |
82.06 (-3.99%) |
87.85 |
79.57 - 90.61 |
1.4536 times |
Fri 07 November 2025 |
85.47 (-4.05%) |
86.39 |
83.33 - 88.62 |
0.7108 times |
Fri 31 October 2025 |
89.08 (0%) |
91.25 |
87.91 - 92.57 |
0.3168 times |
Fri 31 October 2025 |
89.08 (1.9%) |
88.63 |
83.11 - 92.57 |
2.1969 times |
Fri 24 October 2025 |
87.42 (3.47%) |
85.23 |
83.08 - 87.76 |
0.9404 times |
Fri 17 October 2025 |
84.49 (-0.67%) |
85.11 |
83.61 - 87.43 |
1.2182 times |
Tue 07 October 2025 |
85.06 (1.41%) |
84.06 |
83.81 - 86.23 |
0.5653 times |
Fri 03 October 2025 |
83.88 (5.71%) |
79.90 |
79.60 - 84.46 |
1.4581 times |
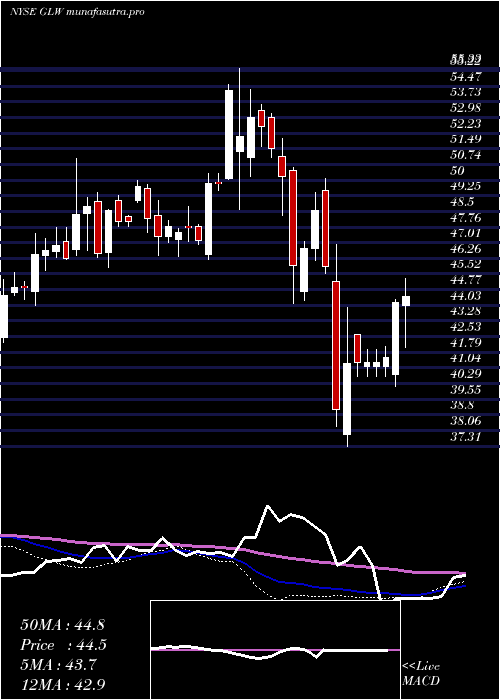
Monthly price and charts CorningIncorporated Strong monthly Stock price targets for CorningIncorporated GLW are 83.57 and 89.19 | Monthly Target 1 | 79.19 | | Monthly Target 2 | 82.33 | | Monthly Target 3 | 84.81 | | Monthly Target 4 | 87.95 | | Monthly Target 5 | 90.43 |
Monthly price and volumes Corning Incorporated
| Date |
Closing |
Open |
Range |
Volume |
Thu 04 December 2025 |
85.47 (1.51%) |
83.35 |
81.67 - 87.29 |
0.15 times |
Fri 28 November 2025 |
84.20 (-5.48%) |
86.39 |
77.39 - 90.61 |
0.8326 times |
Fri 31 October 2025 |
89.08 (8.59%) |
81.46 |
80.88 - 92.57 |
1.2559 times |
Tue 30 September 2025 |
82.03 (22.38%) |
67.00 |
66.14 - 82.21 |
1.8526 times |
Fri 29 August 2025 |
67.03 (5.99%) |
62.00 |
61.44 - 69.29 |
0.9462 times |
Thu 31 July 2025 |
63.24 (20.25%) |
52.44 |
51.32 - 63.91 |
0.9737 times |
Mon 30 June 2025 |
52.59 (6.05%) |
49.18 |
49.10 - 52.86 |
0.6728 times |
Fri 30 May 2025 |
49.59 (11.74%) |
44.67 |
44.33 - 50.19 |
0.9502 times |
Wed 30 April 2025 |
44.38 (-3.06%) |
45.50 |
37.31 - 46.93 |
1.2064 times |
Mon 31 March 2025 |
45.78 (-8.71%) |
50.47 |
44.10 - 50.60 |
1.1595 times |
Fri 28 February 2025 |
50.15 (-3.71%) |
51.05 |
48.32 - 54.31 |
0.784 times |

DMA SMA EMA moving averages of Corning Incorporated GLW
DMA (daily moving average) of Corning Incorporated GLW
| DMA period | DMA value | | 5 day DMA | 83.97 | | 12 day DMA | 82.36 | | 20 day DMA | 83.63 | | 35 day DMA | 85.13 | | 50 day DMA | 84.35 | | 100 day DMA | 74.74 | | 150 day DMA | 66.24 | | 200 day DMA | 61.14 | EMA (exponential moving average) of Corning Incorporated GLW
| EMA period | EMA current | EMA prev | EMA prev2 | | 5 day EMA | 84.04 | 83.32 | 83.2 | | 12 day EMA | 83.52 | 83.17 | 83.1 | | 20 day EMA | 83.7 | 83.51 | 83.51 | | 35 day EMA | 83.54 | 83.43 | 83.42 | | 50 day EMA | 83.85 | 83.78 | 83.79 |
SMA (simple moving average) of Corning Incorporated GLW
| SMA period | SMA current | SMA prev | SMA prev2 | | 5 day SMA | 83.97 | 83.6 | 83.47 | | 12 day SMA | 82.36 | 81.99 | 81.87 | | 20 day SMA | 83.63 | 83.71 | 83.8 | | 35 day SMA | 85.13 | 85.16 | 85.19 | | 50 day SMA | 84.35 | 84.23 | 84.15 | | 100 day SMA | 74.74 | 74.41 | 74.1 | | 150 day SMA | 66.24 | 65.97 | 65.7 | | 200 day SMA | 61.14 | 60.97 | 60.82 |
|
|
