GlobeLife GL full analysis,charts,indicators,moving averages,SMA,DMA,EMA,ADX,MACD,RSIGlobe Life GL WideScreen charts, DMA,SMA,EMA technical analysis, forecast prediction, by indicators ADX,MACD,RSI,CCI NYSE stock exchange
Daily price and charts and targets GlobeLife Strong Daily Stock price targets for GlobeLife GL are 130.54 and 132.3 | Daily Target 1 | 129.27 | | Daily Target 2 | 130.05 | | Daily Target 3 | 131.03333333333 | | Daily Target 4 | 131.81 | | Daily Target 5 | 132.79 |
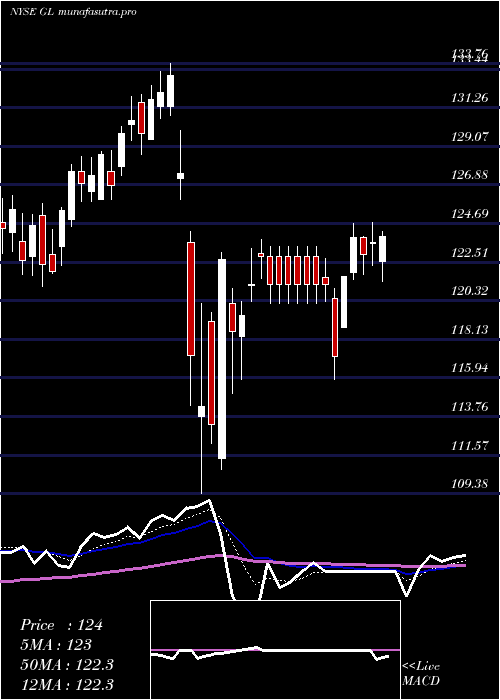
Daily price and volume Globe Life
| Date |
Closing |
Open |
Range |
Volume |
Thu 04 December 2025 |
130.82 (0%) |
130.29 |
130.26 - 132.02 |
0.6345 times |
Wed 03 December 2025 |
130.82 (-0.25%) |
131.40 |
129.21 - 131.79 |
1.2514 times |
Tue 02 December 2025 |
131.15 (-1.04%) |
133.45 |
130.99 - 133.45 |
1.2204 times |
Mon 01 December 2025 |
132.53 (-1.63%) |
134.54 |
132.36 - 135.15 |
1.1118 times |
Fri 28 November 2025 |
134.73 (-0.1%) |
134.71 |
133.69 - 136.07 |
0.4405 times |
Wed 26 November 2025 |
134.87 (-0.37%) |
135.94 |
134.80 - 136.45 |
1.1785 times |
Tue 25 November 2025 |
135.37 (1.58%) |
134.19 |
134.17 - 135.71 |
1.1659 times |
Mon 24 November 2025 |
133.27 (0.64%) |
131.98 |
131.47 - 133.63 |
1.1779 times |
Fri 21 November 2025 |
132.42 (1.57%) |
130.93 |
130.62 - 133.91 |
1.1855 times |
Thu 20 November 2025 |
130.37 (-0.28%) |
131.81 |
129.65 - 132.55 |
0.6336 times |
Wed 19 November 2025 |
130.74 (-0.84%) |
131.36 |
129.42 - 132.21 |
0.7568 times |
Weekly price and charts GlobeLife Strong weekly Stock price targets for GlobeLife GL are 127.05 and 132.99 | Weekly Target 1 | 125.79 | | Weekly Target 2 | 128.3 | | Weekly Target 3 | 131.72666666667 | | Weekly Target 4 | 134.24 | | Weekly Target 5 | 137.67 |
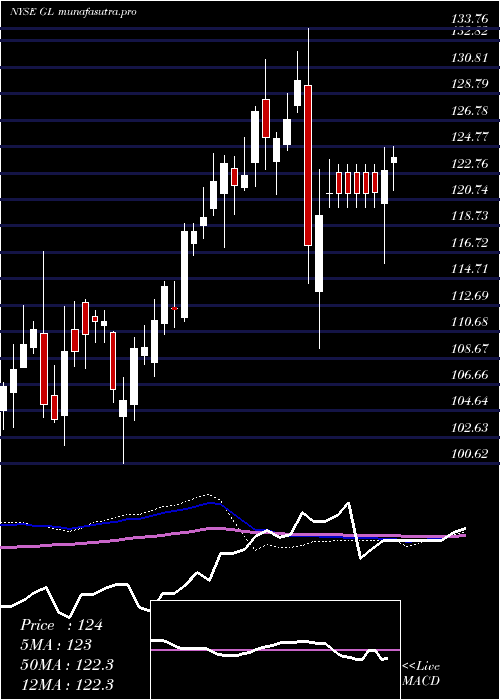
Weekly price and volumes for Globe Life
| Date |
Closing |
Open |
Range |
Volume |
Thu 04 December 2025 |
130.82 (-2.9%) |
134.54 |
129.21 - 135.15 |
0.83 times |
Fri 28 November 2025 |
134.73 (1.74%) |
131.98 |
131.47 - 136.45 |
0.7798 times |
Fri 21 November 2025 |
132.42 (0.46%) |
131.52 |
129.42 - 133.91 |
1.0068 times |
Fri 14 November 2025 |
131.81 (-0.33%) |
131.79 |
131.06 - 134.92 |
0.917 times |
Fri 07 November 2025 |
132.24 (0.56%) |
130.68 |
130.26 - 134.62 |
1.0126 times |
Fri 31 October 2025 |
131.51 (0%) |
131.43 |
130.97 - 133.19 |
0.3645 times |
Fri 31 October 2025 |
131.51 (-1.58%) |
134.40 |
130.97 - 135.37 |
1.3653 times |
Fri 24 October 2025 |
133.62 (-0.86%) |
135.00 |
132.54 - 137.66 |
1.4009 times |
Fri 17 October 2025 |
134.78 (-0.9%) |
136.62 |
132.86 - 140.39 |
0.9724 times |
Fri 10 October 2025 |
136.00 (-1.15%) |
137.25 |
133.97 - 137.99 |
1.3506 times |
Fri 03 October 2025 |
137.58 (-4.83%) |
144.73 |
137.22 - 145.08 |
1.2048 times |
Monthly price and charts GlobeLife Strong monthly Stock price targets for GlobeLife GL are 127.05 and 132.99 | Monthly Target 1 | 125.79 | | Monthly Target 2 | 128.3 | | Monthly Target 3 | 131.72666666667 | | Monthly Target 4 | 134.24 | | Monthly Target 5 | 137.67 |
Monthly price and volumes Globe Life
| Date |
Closing |
Open |
Range |
Volume |
Thu 04 December 2025 |
130.82 (-2.9%) |
134.54 |
129.21 - 135.15 |
0.1701 times |
Fri 28 November 2025 |
134.73 (2.45%) |
130.68 |
129.42 - 136.45 |
0.7615 times |
Fri 31 October 2025 |
131.51 (-8.02%) |
142.07 |
130.97 - 142.45 |
1.2685 times |
Tue 30 September 2025 |
142.97 (2.16%) |
139.57 |
137.90 - 147.83 |
0.9223 times |
Fri 29 August 2025 |
139.95 (-0.37%) |
139.58 |
134.78 - 142.21 |
1.0629 times |
Thu 31 July 2025 |
140.47 (13.02%) |
123.78 |
116.73 - 144.00 |
1.4681 times |
Mon 30 June 2025 |
124.29 (1.99%) |
121.12 |
118.34 - 124.56 |
0.782 times |
Fri 30 May 2025 |
121.87 (-1.19%) |
111.13 |
111.13 - 124.22 |
1.2004 times |
Wed 30 April 2025 |
123.34 (-6.36%) |
131.30 |
109.38 - 133.76 |
1.1825 times |
Mon 31 March 2025 |
131.72 (3.37%) |
128.34 |
121.11 - 132.50 |
1.1817 times |
Fri 28 February 2025 |
127.43 (4.37%) |
121.17 |
117.12 - 127.82 |
1.0595 times |

DMA SMA EMA moving averages of Globe Life GL
DMA (daily moving average) of Globe Life GL
| DMA period | DMA value | | 5 day DMA | 132.01 | | 12 day DMA | 132.41 | | 20 day DMA | 132.42 | | 35 day DMA | 133.05 | | 50 day DMA | 134.83 | | 100 day DMA | 136.39 | | 150 day DMA | 131.22 | | 200 day DMA | 129.39 | EMA (exponential moving average) of Globe Life GL
| EMA period | EMA current | EMA prev | EMA prev2 | | 5 day EMA | 131.69 | 132.12 | 132.77 | | 12 day EMA | 132.29 | 132.56 | 132.88 | | 20 day EMA | 132.72 | 132.92 | 133.14 | | 35 day EMA | 134.07 | 134.26 | 134.46 | | 50 day EMA | 135.35 | 135.54 | 135.73 |
SMA (simple moving average) of Globe Life GL
| SMA period | SMA current | SMA prev | SMA prev2 | | 5 day SMA | 132.01 | 132.82 | 133.73 | | 12 day SMA | 132.41 | 132.46 | 132.55 | | 20 day SMA | 132.42 | 132.57 | 132.7 | | 35 day SMA | 133.05 | 133.26 | 133.52 | | 50 day SMA | 134.83 | 135.08 | 135.4 | | 100 day SMA | 136.39 | 136.26 | 136.16 | | 150 day SMA | 131.22 | 131.17 | 131.12 | | 200 day SMA | 129.39 | 129.36 | 129.32 |
|
|
