SyntheticFixed GJT full analysis,charts,indicators,moving averages,SMA,DMA,EMA,ADX,MACD,RSISynthetic Fixed GJT WideScreen charts, DMA,SMA,EMA technical analysis, forecast prediction, by indicators ADX,MACD,RSI,CCI NYSE stock exchange
operates under Finance sector & deals in Finance Consumer Services
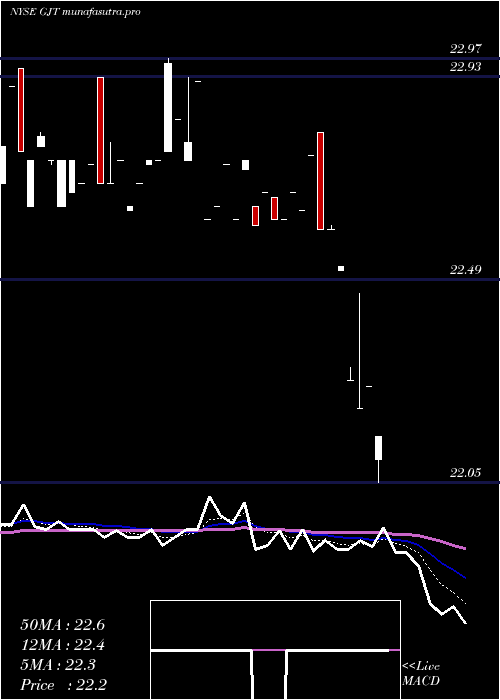
Daily price and charts and targets SyntheticFixed Strong Daily Stock price targets for SyntheticFixed GJT are 22.79 and 22.89 | Daily Target 1 | 22.71 | | Daily Target 2 | 22.77 | | Daily Target 3 | 22.806666666667 | | Daily Target 4 | 22.87 | | Daily Target 5 | 22.91 |
Daily price and volume Synthetic Fixed
| Date |
Closing |
Open |
Range |
Volume |
Tue 21 October 2025 |
22.84 (0.13%) |
22.74 |
22.74 - 22.84 |
0.2844 times |
Mon 20 October 2025 |
22.81 (-0.39%) |
22.81 |
22.81 - 22.81 |
0.0474 times |
Fri 17 October 2025 |
22.90 (-0.52%) |
22.90 |
22.90 - 22.90 |
0.0474 times |
Wed 15 October 2025 |
23.02 (0.09%) |
23.02 |
23.02 - 23.02 |
0.0474 times |
Tue 14 October 2025 |
23.00 (-0.3%) |
23.00 |
23.00 - 23.00 |
0.1422 times |
Wed 01 October 2025 |
23.07 (0%) |
23.07 |
23.07 - 23.07 |
1.7536 times |
Tue 30 September 2025 |
23.07 (0.04%) |
23.06 |
22.85 - 23.07 |
3.2227 times |
Mon 29 September 2025 |
23.06 (0.26%) |
22.83 |
22.83 - 23.06 |
1.2322 times |
Fri 26 September 2025 |
23.00 (0.44%) |
22.90 |
22.88 - 23.00 |
1.6588 times |
Thu 25 September 2025 |
22.90 (0.44%) |
22.98 |
22.83 - 22.99 |
1.564 times |
Wed 24 September 2025 |
22.80 (-0.87%) |
22.80 |
22.80 - 22.80 |
0.8531 times |
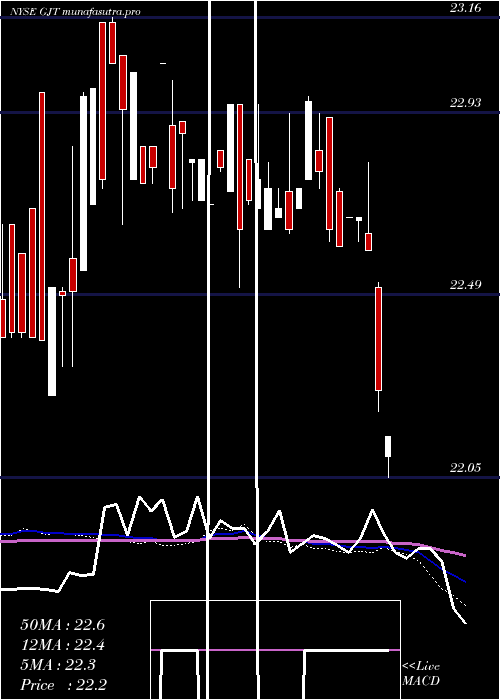
Weekly price and charts SyntheticFixed Strong weekly Stock price targets for SyntheticFixed GJT are 22.79 and 22.89 | Weekly Target 1 | 22.71 | | Weekly Target 2 | 22.77 | | Weekly Target 3 | 22.806666666667 | | Weekly Target 4 | 22.87 | | Weekly Target 5 | 22.91 |
Weekly price and volumes for Synthetic Fixed
| Date |
Closing |
Open |
Range |
Volume |
Tue 21 October 2025 |
22.84 (-0.26%) |
22.81 |
22.74 - 22.84 |
0.1392 times |
Fri 17 October 2025 |
22.90 (-0.74%) |
23.00 |
22.90 - 23.02 |
0.0994 times |
Wed 01 October 2025 |
23.07 (0.3%) |
22.83 |
22.83 - 23.07 |
2.6044 times |
Fri 26 September 2025 |
23.00 (0.04%) |
22.61 |
22.61 - 23.06 |
2.2068 times |
Fri 19 September 2025 |
22.99 (1.95%) |
22.67 |
22.67 - 23.06 |
1.3718 times |
Wed 10 September 2025 |
22.55 (-0.35%) |
22.53 |
22.53 - 22.55 |
0.1193 times |
Fri 05 September 2025 |
22.63 (0.85%) |
22.75 |
22.46 - 22.84 |
0.6163 times |
Fri 29 August 2025 |
22.44 (0%) |
22.44 |
22.44 - 22.44 |
0.2386 times |
Fri 29 August 2025 |
22.44 (-1.06%) |
22.75 |
22.44 - 22.84 |
1.6501 times |
Fri 22 August 2025 |
22.68 (0%) |
22.65 |
22.56 - 23.00 |
0.9543 times |
Thu 07 August 2025 |
22.68 (-0.31%) |
22.68 |
22.68 - 22.68 |
0.0199 times |
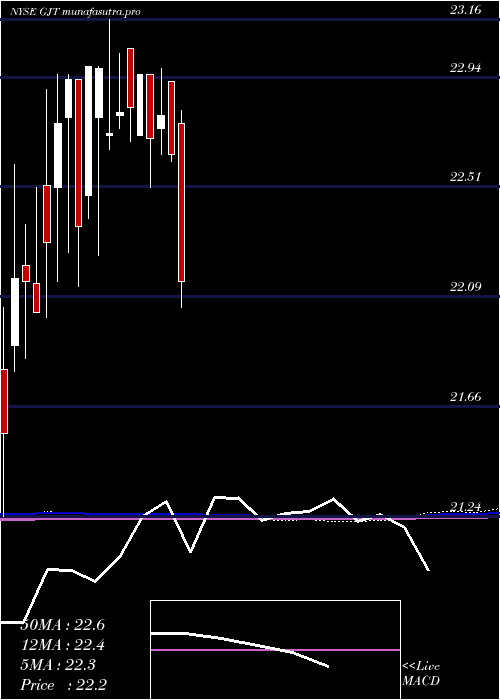
Monthly price and charts SyntheticFixed Strong monthly Stock price targets for SyntheticFixed GJT are 22.63 and 22.96 | Monthly Target 1 | 22.55 | | Monthly Target 2 | 22.7 | | Monthly Target 3 | 22.883333333333 | | Monthly Target 4 | 23.03 | | Monthly Target 5 | 23.21 |
Monthly price and volumes Synthetic Fixed
| Date |
Closing |
Open |
Range |
Volume |
Tue 21 October 2025 |
22.84 (-1%) |
23.07 |
22.74 - 23.07 |
0.3351 times |
Tue 30 September 2025 |
23.07 (2.81%) |
22.75 |
22.46 - 23.07 |
2.1271 times |
Fri 29 August 2025 |
22.44 (-1.28%) |
22.75 |
22.44 - 23.00 |
0.9986 times |
Thu 31 July 2025 |
22.73 (1.02%) |
22.50 |
22.30 - 22.90 |
0.6634 times |
Mon 30 June 2025 |
22.50 (-0.66%) |
22.65 |
22.21 - 22.65 |
0.4583 times |
Thu 29 May 2025 |
22.65 (2.54%) |
22.21 |
22.05 - 22.99 |
2.8316 times |
Wed 30 April 2025 |
22.09 (-2.43%) |
22.76 |
22.05 - 22.81 |
0.3899 times |
Mon 31 March 2025 |
22.64 (-0.66%) |
22.92 |
22.61 - 22.92 |
0.4702 times |
Fri 28 February 2025 |
22.79 (0.4%) |
22.74 |
22.64 - 22.97 |
0.896 times |
Thu 30 January 2025 |
22.70 (-1.09%) |
22.95 |
22.51 - 22.95 |
0.8298 times |
Fri 20 December 2024 |
22.95 (0.57%) |
22.71 |
22.71 - 22.95 |
0.3114 times |
DMA SMA EMA moving averages of Synthetic Fixed GJT
DMA (daily moving average) of Synthetic Fixed GJT
| DMA period | DMA value | | 5 day DMA | 22.91 | | 12 day DMA | 22.96 | | 20 day DMA | 22.86 | | 35 day DMA | 22.78 | | 50 day DMA | 22.7 | | 100 day DMA | 22.64 | | 150 day DMA | 22.7 | | 200 day DMA | 22.66 | EMA (exponential moving average) of Synthetic Fixed GJT
| EMA period | EMA current | EMA prev | EMA prev2 | | 5 day EMA | 22.89 | 22.92 | 22.97 | | 12 day EMA | 22.9 | 22.91 | 22.93 | | 20 day EMA | 22.87 | 22.87 | 22.88 | | 35 day EMA | 22.8 | 22.8 | 22.8 | | 50 day EMA | 22.71 | 22.7 | 22.7 |
SMA (simple moving average) of Synthetic Fixed GJT
| SMA period | SMA current | SMA prev | SMA prev2 | | 5 day SMA | 22.91 | 22.96 | 23.01 | | 12 day SMA | 22.96 | 22.96 | 22.97 | | 20 day SMA | 22.86 | 22.84 | 22.84 | | 35 day SMA | 22.78 | 22.76 | 22.76 | | 50 day SMA | 22.7 | 22.69 | 22.69 | | 100 day SMA | 22.64 | 22.64 | 22.64 | | 150 day SMA | 22.7 | 22.7 | 22.7 | | 200 day SMA | 22.66 | 22.66 | 22.65 |
|
|
