GrahamCorporation GHM full analysis,charts,indicators,moving averages,SMA,DMA,EMA,ADX,MACD,RSIGraham Corporation GHM WideScreen charts, DMA,SMA,EMA technical analysis, forecast prediction, by indicators ADX,MACD,RSI,CCI NYSE stock exchange
operates under Technology sector & deals in Industrial Machinery Components
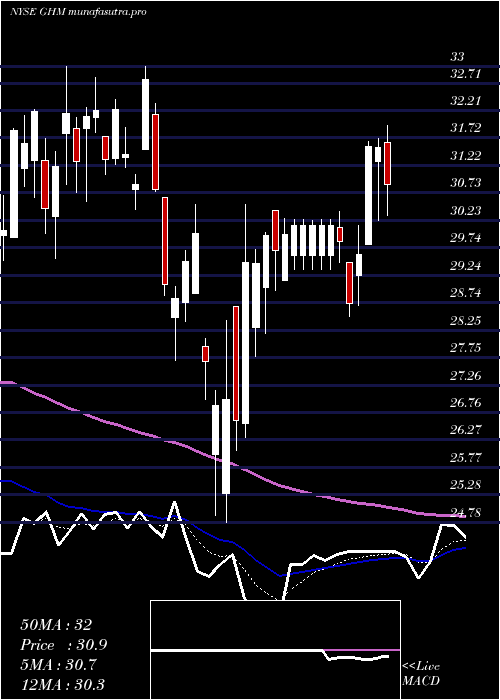
Daily price and charts and targets GrahamCorporation Strong Daily Stock price targets for GrahamCorporation GHM are 57.55 and 60.5 | Daily Target 1 | 55.13 | | Daily Target 2 | 57.02 | | Daily Target 3 | 58.08 | | Daily Target 4 | 59.97 | | Daily Target 5 | 61.03 |
Daily price and volume Graham Corporation
| Date |
Closing |
Open |
Range |
Volume |
Thu 04 December 2025 |
58.91 (2.81%) |
57.58 |
56.19 - 59.14 |
1.2047 times |
Wed 03 December 2025 |
57.30 (1.49%) |
57.13 |
55.51 - 58.55 |
1.3903 times |
Tue 02 December 2025 |
56.46 (2.13%) |
55.85 |
55.07 - 57.15 |
1.4265 times |
Mon 01 December 2025 |
55.28 (-3.86%) |
56.70 |
55.13 - 56.81 |
0.6534 times |
Fri 28 November 2025 |
57.50 (0.42%) |
57.40 |
56.78 - 57.50 |
0.2295 times |
Wed 26 November 2025 |
57.26 (0.69%) |
56.62 |
56.35 - 58.00 |
0.6424 times |
Tue 25 November 2025 |
56.87 (2.58%) |
55.57 |
53.88 - 57.48 |
0.6886 times |
Mon 24 November 2025 |
55.44 (2.67%) |
54.25 |
54.25 - 55.81 |
0.7841 times |
Fri 21 November 2025 |
54.00 (0.82%) |
53.25 |
52.57 - 55.47 |
1.7604 times |
Thu 20 November 2025 |
53.56 (-4.01%) |
57.29 |
53.52 - 57.87 |
1.2201 times |
Wed 19 November 2025 |
55.80 (0.81%) |
55.76 |
55.54 - 56.94 |
0.6732 times |
Weekly price and charts GrahamCorporation Strong weekly Stock price targets for GrahamCorporation GHM are 56.99 and 61.06 | Weekly Target 1 | 53.64 | | Weekly Target 2 | 56.27 | | Weekly Target 3 | 57.706666666667 | | Weekly Target 4 | 60.34 | | Weekly Target 5 | 61.78 |
Weekly price and volumes for Graham Corporation
| Date |
Closing |
Open |
Range |
Volume |
Thu 04 December 2025 |
58.91 (2.45%) |
56.70 |
55.07 - 59.14 |
1.0318 times |
Fri 28 November 2025 |
57.50 (6.48%) |
54.25 |
53.88 - 58.00 |
0.5175 times |
Fri 21 November 2025 |
54.00 (-8.47%) |
59.17 |
52.57 - 59.17 |
1.1741 times |
Fri 14 November 2025 |
59.00 (-5.39%) |
63.75 |
55.37 - 63.82 |
1.1499 times |
Fri 07 November 2025 |
62.36 (0.11%) |
60.61 |
58.01 - 64.66 |
1.1317 times |
Fri 31 October 2025 |
62.29 (0%) |
62.42 |
62.10 - 63.03 |
0.1699 times |
Fri 31 October 2025 |
62.29 (-0.14%) |
63.50 |
58.15 - 63.50 |
1.2073 times |
Fri 24 October 2025 |
62.38 (4.52%) |
60.93 |
57.36 - 63.16 |
1.4078 times |
Fri 17 October 2025 |
59.68 (7.4%) |
56.19 |
55.57 - 64.08 |
1.7503 times |
Tue 07 October 2025 |
55.57 (-0.82%) |
56.69 |
55.34 - 59.50 |
0.4598 times |
Fri 03 October 2025 |
56.03 (4.71%) |
54.02 |
51.53 - 58.61 |
1.4887 times |
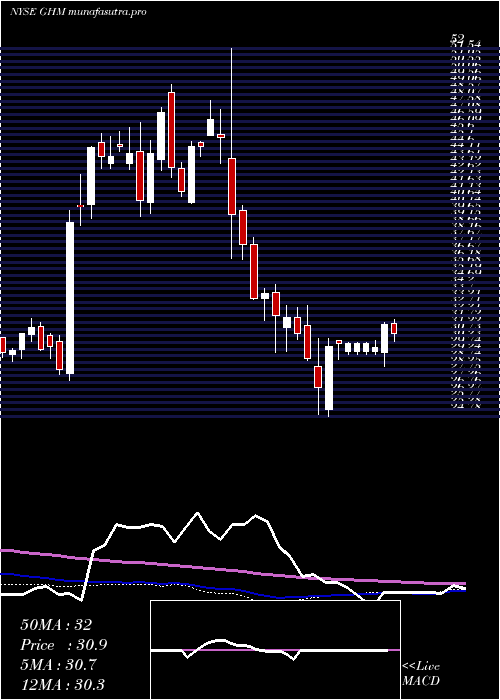
Monthly price and charts GrahamCorporation Strong monthly Stock price targets for GrahamCorporation GHM are 56.99 and 61.06 | Monthly Target 1 | 53.64 | | Monthly Target 2 | 56.27 | | Monthly Target 3 | 57.706666666667 | | Monthly Target 4 | 60.34 | | Monthly Target 5 | 61.78 |
Monthly price and volumes Graham Corporation
| Date |
Closing |
Open |
Range |
Volume |
Thu 04 December 2025 |
58.91 (2.45%) |
56.70 |
55.07 - 59.14 |
0.2286 times |
Fri 28 November 2025 |
57.50 (-7.69%) |
60.61 |
52.57 - 64.66 |
0.8802 times |
Fri 31 October 2025 |
62.29 (13.46%) |
54.08 |
53.30 - 64.08 |
1.226 times |
Tue 30 September 2025 |
54.90 (11.93%) |
47.76 |
46.58 - 55.28 |
1.2457 times |
Fri 29 August 2025 |
49.05 (-14.17%) |
55.81 |
46.08 - 56.93 |
1.2825 times |
Thu 31 July 2025 |
57.15 (15.43%) |
49.26 |
48.80 - 58.00 |
1.2107 times |
Mon 30 June 2025 |
49.51 (25.56%) |
39.67 |
38.93 - 51.28 |
1.3466 times |
Fri 30 May 2025 |
39.43 (29.36%) |
30.62 |
30.51 - 41.18 |
0.7243 times |
Wed 30 April 2025 |
30.48 (5.76%) |
28.75 |
24.78 - 31.94 |
0.7189 times |
Mon 31 March 2025 |
28.82 (-14.81%) |
33.92 |
27.70 - 34.51 |
1.1366 times |
Fri 28 February 2025 |
33.83 (-25.52%) |
43.87 |
31.88 - 52.00 |
1.6984 times |

DMA SMA EMA moving averages of Graham Corporation GHM
DMA (daily moving average) of Graham Corporation GHM
| DMA period | DMA value | | 5 day DMA | 57.09 | | 12 day DMA | 56.14 | | 20 day DMA | 57.67 | | 35 day DMA | 59.2 | | 50 day DMA | 58.04 | | 100 day DMA | 54.42 | | 150 day DMA | 50.18 | | 200 day DMA | 45.41 | EMA (exponential moving average) of Graham Corporation GHM
| EMA period | EMA current | EMA prev | EMA prev2 | | 5 day EMA | 57.39 | 56.63 | 56.3 | | 12 day EMA | 57.15 | 56.83 | 56.74 | | 20 day EMA | 57.48 | 57.33 | 57.33 | | 35 day EMA | 57.32 | 57.23 | 57.23 | | 50 day EMA | 57.53 | 57.47 | 57.48 |
SMA (simple moving average) of Graham Corporation GHM
| SMA period | SMA current | SMA prev | SMA prev2 | | 5 day SMA | 57.09 | 56.76 | 56.67 | | 12 day SMA | 56.14 | 55.86 | 56.01 | | 20 day SMA | 57.67 | 57.92 | 58.15 | | 35 day SMA | 59.2 | 59.31 | 59.4 | | 50 day SMA | 58.04 | 57.94 | 57.87 | | 100 day SMA | 54.42 | 54.34 | 54.3 | | 150 day SMA | 50.18 | 50 | 49.83 | | 200 day SMA | 45.41 | 45.3 | 45.21 |
|
|
