GabelliGlobal GGZ full analysis,charts,indicators,moving averages,SMA,DMA,EMA,ADX,MACD,RSIGabelli Global GGZ WideScreen charts, DMA,SMA,EMA technical analysis, forecast prediction, by indicators ADX,MACD,RSI,CCI NYSE stock exchange
operates under N A sector & deals in N A
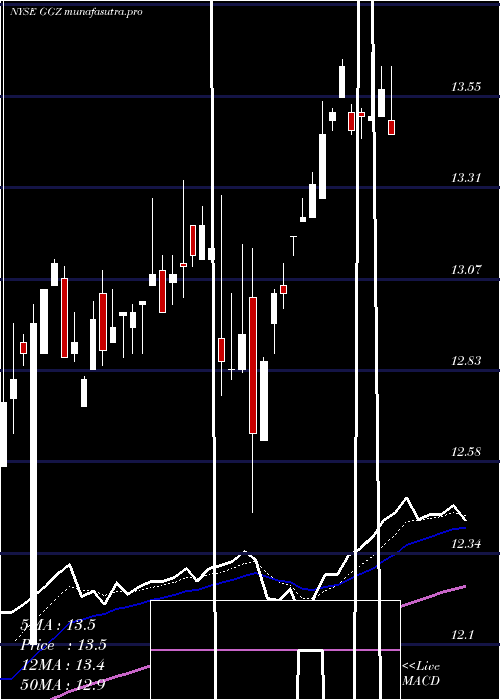
Daily price and charts and targets GabelliGlobal Strong Daily Stock price targets for GabelliGlobal GGZ are 14.15 and 14.28 | Daily Target 1 | 14.12 | | Daily Target 2 | 14.17 | | Daily Target 3 | 14.253333333333 | | Daily Target 4 | 14.3 | | Daily Target 5 | 14.38 |
Daily price and volume Gabelli Global
| Date |
Closing |
Open |
Range |
Volume |
Fri 05 December 2025 |
14.21 (-0.63%) |
14.34 |
14.21 - 14.34 |
0.3439 times |
Thu 04 December 2025 |
14.30 (0.56%) |
14.25 |
14.19 - 14.34 |
2.3312 times |
Wed 03 December 2025 |
14.22 (0.57%) |
14.13 |
14.11 - 14.22 |
1.0064 times |
Tue 02 December 2025 |
14.14 (-0.63%) |
14.22 |
14.05 - 14.22 |
1.3503 times |
Mon 01 December 2025 |
14.23 (-0.14%) |
14.20 |
14.10 - 14.35 |
1.2229 times |
Fri 28 November 2025 |
14.25 (0.56%) |
14.24 |
14.24 - 14.25 |
0.1146 times |
Wed 26 November 2025 |
14.17 (0.78%) |
14.14 |
14.14 - 14.19 |
0.293 times |
Tue 25 November 2025 |
14.06 (1.3%) |
13.85 |
13.85 - 14.14 |
0.8153 times |
Mon 24 November 2025 |
13.88 (1.31%) |
13.57 |
13.57 - 13.95 |
1.4522 times |
Fri 21 November 2025 |
13.70 (1.56%) |
13.55 |
13.55 - 13.73 |
1.0701 times |
Thu 20 November 2025 |
13.49 (-1.89%) |
13.76 |
13.35 - 13.84 |
1.2739 times |
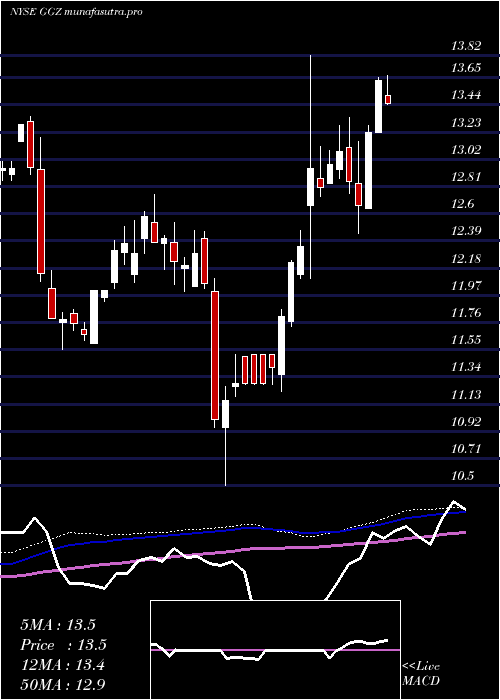
Weekly price and charts GabelliGlobal Strong weekly Stock price targets for GabelliGlobal GGZ are 14.13 and 14.43 | Weekly Target 1 | 13.9 | | Weekly Target 2 | 14.06 | | Weekly Target 3 | 14.203333333333 | | Weekly Target 4 | 14.36 | | Weekly Target 5 | 14.5 |
Weekly price and volumes for Gabelli Global
| Date |
Closing |
Open |
Range |
Volume |
Fri 05 December 2025 |
14.21 (-0.28%) |
14.20 |
14.05 - 14.35 |
1.3262 times |
Fri 28 November 2025 |
14.25 (4.01%) |
13.57 |
13.57 - 14.25 |
0.5672 times |
Fri 21 November 2025 |
13.70 (-2.77%) |
14.06 |
13.35 - 14.06 |
1.8259 times |
Fri 14 November 2025 |
14.09 (1.88%) |
13.99 |
13.88 - 14.26 |
0.7131 times |
Fri 07 November 2025 |
13.83 (-1.98%) |
13.86 |
13.81 - 13.99 |
0.7104 times |
Fri 31 October 2025 |
14.11 (0%) |
14.02 |
14.02 - 14.11 |
0.1864 times |
Fri 31 October 2025 |
14.11 (-1.05%) |
14.31 |
13.93 - 14.34 |
1.2668 times |
Fri 24 October 2025 |
14.26 (2.44%) |
13.99 |
13.99 - 14.30 |
0.9832 times |
Fri 17 October 2025 |
13.92 (-3.67%) |
14.13 |
13.75 - 14.27 |
2.0015 times |
Tue 07 October 2025 |
14.45 (0.49%) |
14.43 |
14.41 - 14.65 |
0.4192 times |
Fri 03 October 2025 |
14.38 (-0.69%) |
14.69 |
14.35 - 14.69 |
1.3164 times |
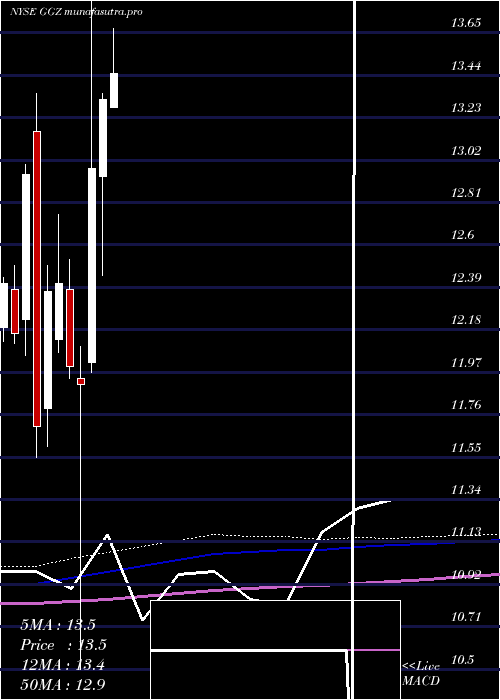
Monthly price and charts GabelliGlobal Strong monthly Stock price targets for GabelliGlobal GGZ are 14.13 and 14.43 | Monthly Target 1 | 13.9 | | Monthly Target 2 | 14.06 | | Monthly Target 3 | 14.203333333333 | | Monthly Target 4 | 14.36 | | Monthly Target 5 | 14.5 |
Monthly price and volumes Gabelli Global
| Date |
Closing |
Open |
Range |
Volume |
Fri 05 December 2025 |
14.21 (-0.28%) |
14.20 |
14.05 - 14.35 |
0.2286 times |
Fri 28 November 2025 |
14.25 (0.99%) |
13.86 |
13.35 - 14.26 |
0.6579 times |
Fri 31 October 2025 |
14.11 (-2.35%) |
14.42 |
13.75 - 14.65 |
0.9747 times |
Tue 30 September 2025 |
14.45 (0.42%) |
14.22 |
14.17 - 14.87 |
1.2627 times |
Fri 29 August 2025 |
14.39 (5.89%) |
13.31 |
13.30 - 14.69 |
1.1812 times |
Thu 31 July 2025 |
13.59 (2.03%) |
13.28 |
13.28 - 13.88 |
0.8303 times |
Mon 30 June 2025 |
13.32 (2.62%) |
12.94 |
12.45 - 13.35 |
0.9628 times |
Fri 30 May 2025 |
12.98 (8.98%) |
12.02 |
11.97 - 13.82 |
0.8939 times |
Wed 30 April 2025 |
11.91 (-0.75%) |
11.94 |
10.50 - 12.10 |
1.5772 times |
Mon 31 March 2025 |
12.00 (-3.3%) |
12.38 |
11.94 - 12.53 |
1.4308 times |
Fri 28 February 2025 |
12.41 (0.32%) |
12.13 |
12.07 - 12.75 |
0.9791 times |
DMA SMA EMA moving averages of Gabelli Global GGZ
DMA (daily moving average) of Gabelli Global GGZ
| DMA period | DMA value | | 5 day DMA | 14.22 | | 12 day DMA | 14.03 | | 20 day DMA | 14.01 | | 35 day DMA | 14.04 | | 50 day DMA | 14.14 | | 100 day DMA | 14.07 | | 150 day DMA | 13.69 | | 200 day DMA | 13.23 | EMA (exponential moving average) of Gabelli Global GGZ
| EMA period | EMA current | EMA prev | EMA prev2 | | 5 day EMA | 14.21 | 14.21 | 14.16 | | 12 day EMA | 14.12 | 14.1 | 14.06 | | 20 day EMA | 14.07 | 14.06 | 14.04 | | 35 day EMA | 14.13 | 14.13 | 14.12 | | 50 day EMA | 14.18 | 14.18 | 14.17 |
SMA (simple moving average) of Gabelli Global GGZ
| SMA period | SMA current | SMA prev | SMA prev2 | | 5 day SMA | 14.22 | 14.23 | 14.2 | | 12 day SMA | 14.03 | 14 | 13.96 | | 20 day SMA | 14.01 | 14 | 13.98 | | 35 day SMA | 14.04 | 14.02 | 14.02 | | 50 day SMA | 14.14 | 14.15 | 14.16 | | 100 day SMA | 14.07 | 14.07 | 14.06 | | 150 day SMA | 13.69 | 13.67 | 13.65 | | 200 day SMA | 13.23 | 13.22 | 13.21 |
|
|
