GracoInc GGG full analysis,charts,indicators,moving averages,SMA,DMA,EMA,ADX,MACD,RSIGraco Inc GGG WideScreen charts, DMA,SMA,EMA technical analysis, forecast prediction, by indicators ADX,MACD,RSI,CCI NYSE stock exchange
operates under Capital Goods sector & deals in Fluid Controls
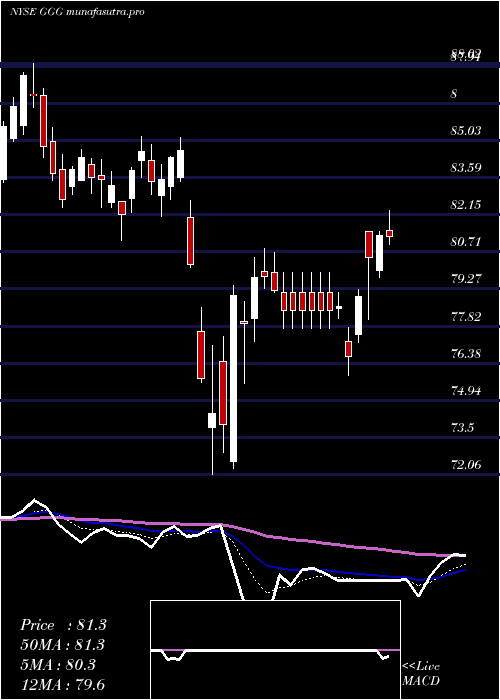
Daily price and charts and targets GracoInc Strong Daily Stock price targets for GracoInc GGG are 83.01 and 84.72 | Daily Target 1 | 81.71 | | Daily Target 2 | 82.59 | | Daily Target 3 | 83.42 | | Daily Target 4 | 84.3 | | Daily Target 5 | 85.13 |
Daily price and volume Graco Inc
| Date |
Closing |
Open |
Range |
Volume |
Fri 05 December 2025 |
83.47 (0.06%) |
83.18 |
82.54 - 84.25 |
0.6907 times |
Thu 04 December 2025 |
83.42 (0.52%) |
83.00 |
82.55 - 83.87 |
0.6949 times |
Wed 03 December 2025 |
82.99 (0.62%) |
82.87 |
82.44 - 83.23 |
0.8008 times |
Tue 02 December 2025 |
82.48 (0.28%) |
82.66 |
81.85 - 82.96 |
0.8093 times |
Mon 01 December 2025 |
82.25 (-0.23%) |
81.79 |
81.32 - 83.16 |
1.0595 times |
Fri 28 November 2025 |
82.44 (0.16%) |
82.81 |
82.38 - 82.99 |
0.5536 times |
Wed 26 November 2025 |
82.31 (-0.68%) |
82.56 |
82.30 - 83.57 |
0.9047 times |
Tue 25 November 2025 |
82.87 (2.51%) |
81.44 |
81.16 - 83.02 |
0.8269 times |
Mon 24 November 2025 |
80.84 (-1.75%) |
82.26 |
80.82 - 82.41 |
2.2393 times |
Fri 21 November 2025 |
82.28 (3.26%) |
79.87 |
79.36 - 82.77 |
1.4204 times |
Thu 20 November 2025 |
79.68 (0.4%) |
80.35 |
79.04 - 80.59 |
1.3391 times |
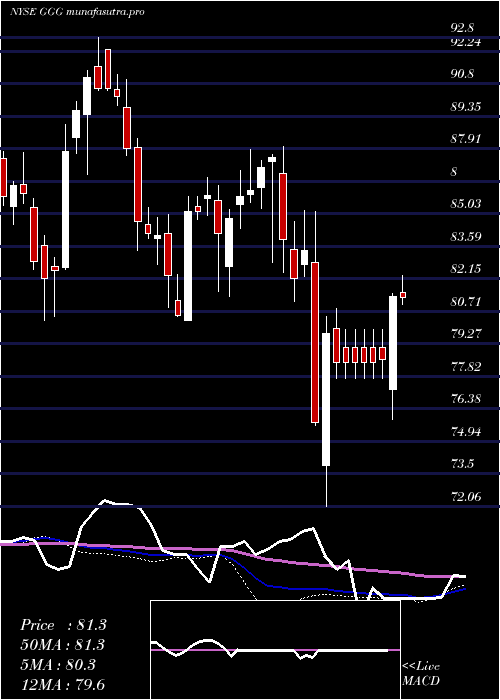
Weekly price and charts GracoInc Strong weekly Stock price targets for GracoInc GGG are 82.4 and 85.33 | Weekly Target 1 | 80.08 | | Weekly Target 2 | 81.78 | | Weekly Target 3 | 83.013333333333 | | Weekly Target 4 | 84.71 | | Weekly Target 5 | 85.94 |
Weekly price and volumes for Graco Inc
| Date |
Closing |
Open |
Range |
Volume |
Fri 05 December 2025 |
83.47 (1.25%) |
81.79 |
81.32 - 84.25 |
0.9312 times |
Fri 28 November 2025 |
82.44 (0.19%) |
82.26 |
80.82 - 83.57 |
1.039 times |
Fri 21 November 2025 |
82.28 (2.66%) |
80.12 |
78.87 - 82.77 |
1.3657 times |
Fri 14 November 2025 |
80.15 (-1.84%) |
81.78 |
80.04 - 83.44 |
1.2634 times |
Fri 07 November 2025 |
81.65 (-0.15%) |
81.30 |
80.50 - 82.98 |
0.7833 times |
Fri 31 October 2025 |
81.77 (0%) |
80.22 |
80.05 - 81.97 |
0.6049 times |
Fri 31 October 2025 |
81.77 (-0.76%) |
82.68 |
80.05 - 83.26 |
1.5326 times |
Fri 24 October 2025 |
82.40 (0.12%) |
82.41 |
79.67 - 84.40 |
1.3512 times |
Fri 17 October 2025 |
82.30 (-1.39%) |
80.94 |
79.88 - 82.82 |
0.9223 times |
Tue 07 October 2025 |
83.46 (-1.53%) |
85.02 |
83.33 - 85.26 |
0.2065 times |
Fri 03 October 2025 |
84.76 (0.06%) |
85.25 |
83.97 - 85.49 |
0.7099 times |
Monthly price and charts GracoInc Strong monthly Stock price targets for GracoInc GGG are 82.4 and 85.33 | Monthly Target 1 | 80.08 | | Monthly Target 2 | 81.78 | | Monthly Target 3 | 83.013333333333 | | Monthly Target 4 | 84.71 | | Monthly Target 5 | 85.94 |
Monthly price and volumes Graco Inc
| Date |
Closing |
Open |
Range |
Volume |
Fri 05 December 2025 |
83.47 (1.25%) |
81.79 |
81.32 - 84.25 |
0.229 times |
Fri 28 November 2025 |
82.44 (0.82%) |
81.30 |
78.87 - 83.57 |
1.0945 times |
Fri 31 October 2025 |
81.77 (-3.75%) |
84.61 |
79.67 - 85.44 |
1.246 times |
Tue 30 September 2025 |
84.96 (-0.5%) |
84.53 |
83.55 - 87.01 |
0.9277 times |
Fri 29 August 2025 |
85.39 (1.68%) |
83.13 |
81.57 - 87.98 |
0.9205 times |
Thu 31 July 2025 |
83.98 (-2.31%) |
85.64 |
82.39 - 89.67 |
1.1027 times |
Mon 30 June 2025 |
85.97 (1.55%) |
84.45 |
82.91 - 87.07 |
0.8961 times |
Fri 30 May 2025 |
84.66 (3.74%) |
81.55 |
81.30 - 88.70 |
0.9965 times |
Wed 30 April 2025 |
81.61 (-2.28%) |
83.23 |
72.06 - 85.15 |
1.479 times |
Mon 31 March 2025 |
83.51 (-4.09%) |
87.37 |
81.16 - 88.02 |
1.1081 times |
Fri 28 February 2025 |
87.07 (3.45%) |
82.71 |
81.38 - 87.89 |
0.9905 times |

DMA SMA EMA moving averages of Graco Inc GGG
DMA (daily moving average) of Graco Inc GGG
| DMA period | DMA value | | 5 day DMA | 82.92 | | 12 day DMA | 82.03 | | 20 day DMA | 81.61 | | 35 day DMA | 81.71 | | 50 day DMA | 82.32 | | 100 day DMA | 83.81 | | 150 day DMA | 84.24 | | 200 day DMA | 83.74 | EMA (exponential moving average) of Graco Inc GGG
| EMA period | EMA current | EMA prev | EMA prev2 | | 5 day EMA | 83.01 | 82.78 | 82.46 | | 12 day EMA | 82.35 | 82.15 | 81.92 | | 20 day EMA | 82.09 | 81.95 | 81.8 | | 35 day EMA | 82.25 | 82.18 | 82.11 | | 50 day EMA | 82.6 | 82.56 | 82.52 |
SMA (simple moving average) of Graco Inc GGG
| SMA period | SMA current | SMA prev | SMA prev2 | | 5 day SMA | 82.92 | 82.72 | 82.49 | | 12 day SMA | 82.03 | 81.67 | 81.33 | | 20 day SMA | 81.61 | 81.49 | 81.43 | | 35 day SMA | 81.71 | 81.65 | 81.62 | | 50 day SMA | 82.32 | 82.34 | 82.37 | | 100 day SMA | 83.81 | 83.85 | 83.91 | | 150 day SMA | 84.24 | 84.22 | 84.21 | | 200 day SMA | 83.74 | 83.76 | 83.77 |
|
|
