GerdauS GGB full analysis,charts,indicators,moving averages,SMA,DMA,EMA,ADX,MACD,RSIGerdau S GGB WideScreen charts, DMA,SMA,EMA technical analysis, forecast prediction, by indicators ADX,MACD,RSI,CCI NYSE stock exchange
operates under Capital Goods sector & deals in Steel Iron Ore
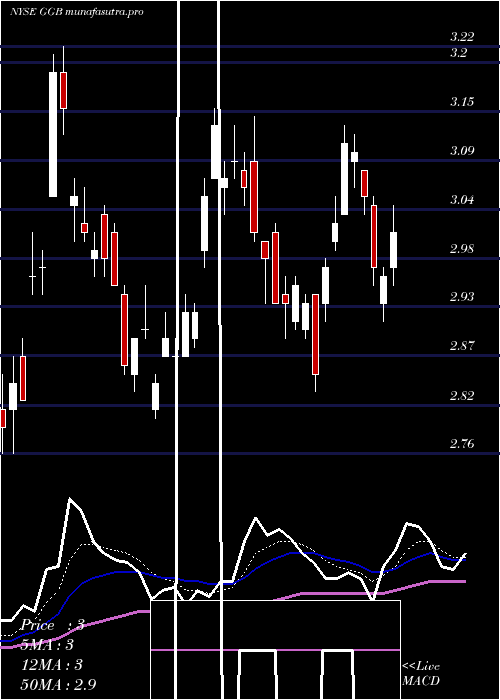
Daily price and charts and targets GerdauS Strong Daily Stock price targets for GerdauS GGB are 3.36 and 3.59 | Daily Target 1 | 3.31 | | Daily Target 2 | 3.4 | | Daily Target 3 | 3.5433333333333 | | Daily Target 4 | 3.63 | | Daily Target 5 | 3.77 |
Daily price and volume Gerdau S
| Date |
Closing |
Open |
Range |
Volume |
Fri 05 December 2025 |
3.48 (-5.95%) |
3.66 |
3.46 - 3.69 |
2.488 times |
Thu 04 December 2025 |
3.70 (0.82%) |
3.69 |
3.68 - 3.72 |
0.5817 times |
Wed 03 December 2025 |
3.67 (2.51%) |
3.62 |
3.61 - 3.71 |
0.9009 times |
Tue 02 December 2025 |
3.58 (0.28%) |
3.57 |
3.55 - 3.59 |
0.5537 times |
Mon 01 December 2025 |
3.57 (-0.83%) |
3.55 |
3.55 - 3.62 |
1.104 times |
Fri 28 November 2025 |
3.60 (0.28%) |
3.60 |
3.59 - 3.61 |
0.2458 times |
Wed 26 November 2025 |
3.59 (2.87%) |
3.55 |
3.55 - 3.60 |
0.4436 times |
Tue 25 November 2025 |
3.49 (1.16%) |
3.45 |
3.43 - 3.50 |
0.6559 times |
Mon 24 November 2025 |
3.45 (1.47%) |
3.43 |
3.42 - 3.48 |
0.9705 times |
Fri 21 November 2025 |
3.40 (0.59%) |
3.39 |
3.36 - 3.44 |
2.0558 times |
Thu 20 November 2025 |
3.38 (-2.31%) |
3.50 |
3.36 - 3.52 |
0.776 times |
Weekly price and charts GerdauS Strong weekly Stock price targets for GerdauS GGB are 3.34 and 3.6 | Weekly Target 1 | 3.29 | | Weekly Target 2 | 3.39 | | Weekly Target 3 | 3.5533333333333 | | Weekly Target 4 | 3.65 | | Weekly Target 5 | 3.81 |
Weekly price and volumes for Gerdau S
| Date |
Closing |
Open |
Range |
Volume |
Fri 05 December 2025 |
3.48 (-3.33%) |
3.55 |
3.46 - 3.72 |
0.9292 times |
Fri 28 November 2025 |
3.60 (5.88%) |
3.43 |
3.42 - 3.61 |
0.3823 times |
Fri 21 November 2025 |
3.40 (-3.95%) |
3.50 |
3.36 - 3.54 |
1.1209 times |
Fri 14 November 2025 |
3.54 (-0.84%) |
3.60 |
3.51 - 3.66 |
0.6568 times |
Fri 07 November 2025 |
3.57 (2.29%) |
3.43 |
3.40 - 3.63 |
0.9601 times |
Fri 31 October 2025 |
3.49 (0%) |
3.41 |
3.41 - 3.51 |
0.2986 times |
Fri 31 October 2025 |
3.49 (3.56%) |
3.38 |
3.36 - 3.61 |
1.5971 times |
Fri 24 October 2025 |
3.37 (1.2%) |
3.33 |
3.32 - 3.44 |
1.4949 times |
Fri 17 October 2025 |
3.33 (4.39%) |
3.21 |
3.18 - 3.35 |
1.8069 times |
Tue 07 October 2025 |
3.19 (-2.45%) |
3.25 |
3.17 - 3.30 |
0.7533 times |
Fri 03 October 2025 |
3.27 (6.51%) |
3.14 |
3.07 - 3.28 |
1.4935 times |

Monthly price and charts GerdauS Strong monthly Stock price targets for GerdauS GGB are 3.34 and 3.6 | Monthly Target 1 | 3.29 | | Monthly Target 2 | 3.39 | | Monthly Target 3 | 3.5533333333333 | | Monthly Target 4 | 3.65 | | Monthly Target 5 | 3.81 |
Monthly price and volumes Gerdau S
| Date |
Closing |
Open |
Range |
Volume |
Fri 05 December 2025 |
3.48 (-3.33%) |
3.55 |
3.46 - 3.72 |
0.2714 times |
Fri 28 November 2025 |
3.60 (3.15%) |
3.43 |
3.36 - 3.66 |
0.9112 times |
Fri 31 October 2025 |
3.49 (12.58%) |
3.11 |
3.10 - 3.61 |
2.034 times |
Tue 30 September 2025 |
3.10 (0.65%) |
3.04 |
2.98 - 3.23 |
1.1387 times |
Fri 29 August 2025 |
3.08 (4.05%) |
2.89 |
2.85 - 3.11 |
0.716 times |
Thu 31 July 2025 |
2.96 (1.37%) |
2.89 |
2.83 - 3.15 |
1.1631 times |
Mon 30 June 2025 |
2.92 (11.03%) |
2.81 |
2.76 - 3.22 |
1.1086 times |
Fri 30 May 2025 |
2.63 (0.77%) |
2.63 |
2.48 - 2.86 |
1.0795 times |
Wed 30 April 2025 |
2.61 (-8.1%) |
2.85 |
2.27 - 2.96 |
0.8846 times |
Mon 31 March 2025 |
2.84 (0.35%) |
2.87 |
2.74 - 3.08 |
0.6929 times |
Fri 28 February 2025 |
2.83 (-2.75%) |
2.92 |
2.80 - 3.11 |
0.847 times |

DMA SMA EMA moving averages of Gerdau S GGB
DMA (daily moving average) of Gerdau S GGB
| DMA period | DMA value | | 5 day DMA | 3.6 | | 12 day DMA | 3.53 | | 20 day DMA | 3.54 | | 35 day DMA | 3.5 | | 50 day DMA | 3.4 | | 100 day DMA | 3.21 | | 150 day DMA | 3.09 | | 200 day DMA | 3 | EMA (exponential moving average) of Gerdau S GGB
| EMA period | EMA current | EMA prev | EMA prev2 | | 5 day EMA | 3.58 | 3.63 | 3.59 | | 12 day EMA | 3.56 | 3.58 | 3.56 | | 20 day EMA | 3.54 | 3.55 | 3.53 | | 35 day EMA | 3.47 | 3.47 | 3.46 | | 50 day EMA | 3.4 | 3.4 | 3.39 |
SMA (simple moving average) of Gerdau S GGB
| SMA period | SMA current | SMA prev | SMA prev2 | | 5 day SMA | 3.6 | 3.62 | 3.6 | | 12 day SMA | 3.53 | 3.53 | 3.51 | | 20 day SMA | 3.54 | 3.55 | 3.54 | | 35 day SMA | 3.5 | 3.49 | 3.48 | | 50 day SMA | 3.4 | 3.4 | 3.38 | | 100 day SMA | 3.21 | 3.21 | 3.2 | | 150 day SMA | 3.09 | 3.08 | 3.08 | | 200 day SMA | 3 | 3 | 3 |
|
|
