GoldFields GFI full analysis,charts,indicators,moving averages,SMA,DMA,EMA,ADX,MACD,RSIGold Fields GFI WideScreen charts, DMA,SMA,EMA technical analysis, forecast prediction, by indicators ADX,MACD,RSI,CCI NYSE stock exchange
operates under Basic Industries sector & deals in Precious Metals
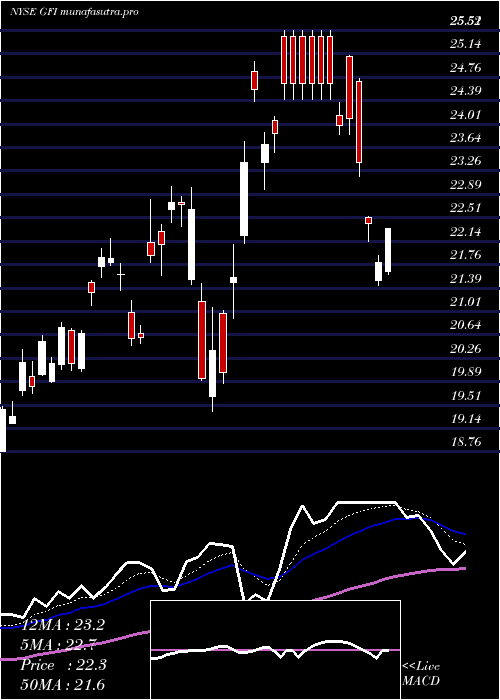
Daily price and charts and targets GoldFields Strong Daily Stock price targets for GoldFields GFI are 41.9 and 44.6 | Daily Target 1 | 40.01 | | Daily Target 2 | 41.09 | | Daily Target 3 | 42.706666666667 | | Daily Target 4 | 43.79 | | Daily Target 5 | 45.41 |
Daily price and volume Gold Fields
| Date |
Closing |
Open |
Range |
Volume |
Fri 05 December 2025 |
42.18 (1.35%) |
42.00 |
41.62 - 44.32 |
0.7704 times |
Thu 04 December 2025 |
41.62 (1.91%) |
40.73 |
40.68 - 41.70 |
0.7947 times |
Wed 03 December 2025 |
40.84 (-1.3%) |
41.75 |
40.83 - 42.03 |
0.6765 times |
Tue 02 December 2025 |
41.38 (-3.11%) |
41.90 |
40.22 - 42.22 |
1.0794 times |
Mon 01 December 2025 |
42.71 (-0.42%) |
43.42 |
42.39 - 43.48 |
1.3538 times |
Fri 28 November 2025 |
42.89 (-0.76%) |
42.38 |
41.61 - 42.89 |
1.6391 times |
Wed 26 November 2025 |
43.22 (6.17%) |
41.44 |
41.44 - 43.24 |
0.8924 times |
Tue 25 November 2025 |
40.71 (0.35%) |
39.31 |
39.29 - 41.08 |
0.5594 times |
Mon 24 November 2025 |
40.57 (5.51%) |
38.28 |
37.98 - 40.65 |
0.9026 times |
Fri 21 November 2025 |
38.45 (1.32%) |
37.79 |
37.57 - 39.32 |
1.3317 times |
Thu 20 November 2025 |
37.95 (-6.46%) |
39.86 |
37.75 - 40.73 |
1.6347 times |
Weekly price and charts GoldFields Strong weekly Stock price targets for GoldFields GFI are 39.15 and 43.25 | Weekly Target 1 | 38.14 | | Weekly Target 2 | 40.16 | | Weekly Target 3 | 42.24 | | Weekly Target 4 | 44.26 | | Weekly Target 5 | 46.34 |
Weekly price and volumes for Gold Fields
| Date |
Closing |
Open |
Range |
Volume |
Fri 05 December 2025 |
42.18 (-1.66%) |
43.42 |
40.22 - 44.32 |
0.8025 times |
Fri 28 November 2025 |
42.89 (11.55%) |
38.28 |
37.98 - 43.24 |
0.6856 times |
Fri 21 November 2025 |
38.45 (-5.81%) |
40.22 |
37.57 - 42.03 |
1.2212 times |
Fri 14 November 2025 |
40.82 (4.69%) |
41.06 |
39.88 - 43.68 |
1.2465 times |
Fri 07 November 2025 |
38.99 (1.51%) |
36.17 |
35.46 - 39.45 |
1.0612 times |
Fri 31 October 2025 |
38.41 (0%) |
39.02 |
38.39 - 39.38 |
0.1933 times |
Fri 31 October 2025 |
38.41 (-4.69%) |
37.83 |
36.37 - 39.86 |
1.3083 times |
Fri 24 October 2025 |
40.30 (-6.86%) |
43.19 |
35.76 - 44.44 |
1.2613 times |
Fri 17 October 2025 |
43.27 (5.54%) |
42.44 |
41.63 - 47.21 |
1.1949 times |
Fri 10 October 2025 |
41.00 (-2.68%) |
43.00 |
39.30 - 43.66 |
1.0252 times |
Fri 03 October 2025 |
42.13 (3.13%) |
42.00 |
40.55 - 43.19 |
0.9028 times |
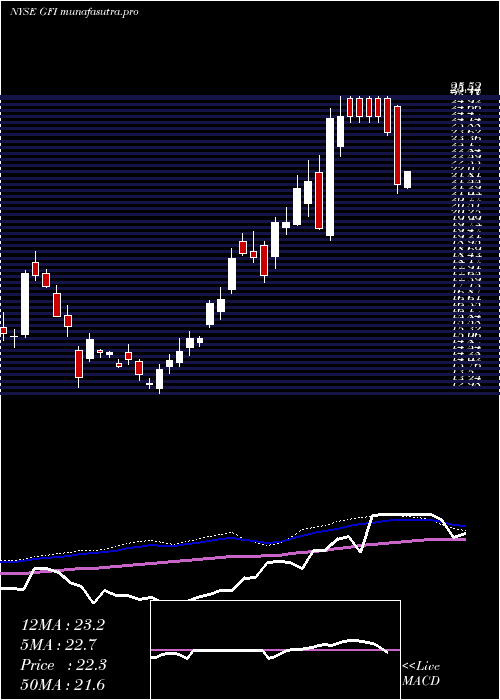
Monthly price and charts GoldFields Strong monthly Stock price targets for GoldFields GFI are 39.15 and 43.25 | Monthly Target 1 | 38.14 | | Monthly Target 2 | 40.16 | | Monthly Target 3 | 42.24 | | Monthly Target 4 | 44.26 | | Monthly Target 5 | 46.34 |
Monthly price and volumes Gold Fields
| Date |
Closing |
Open |
Range |
Volume |
Fri 05 December 2025 |
42.18 (-1.66%) |
43.42 |
40.22 - 44.32 |
0.1847 times |
Fri 28 November 2025 |
42.89 (11.66%) |
36.17 |
35.46 - 43.68 |
0.97 times |
Fri 31 October 2025 |
38.41 (-8.46%) |
42.10 |
35.76 - 47.21 |
1.2584 times |
Tue 30 September 2025 |
41.96 (25.33%) |
33.80 |
33.31 - 42.74 |
1.2248 times |
Fri 29 August 2025 |
33.48 (37.44%) |
25.31 |
24.78 - 33.57 |
1.0455 times |
Thu 31 July 2025 |
24.36 (2.92%) |
24.18 |
23.24 - 26.07 |
0.8427 times |
Mon 30 June 2025 |
23.67 (2.91%) |
23.94 |
22.40 - 26.36 |
0.9007 times |
Fri 30 May 2025 |
23.00 (2.04%) |
21.67 |
19.35 - 23.50 |
1.0957 times |
Wed 30 April 2025 |
22.54 (2.04%) |
22.65 |
19.41 - 25.52 |
1.3833 times |
Mon 31 March 2025 |
22.09 (22.93%) |
18.74 |
18.25 - 22.80 |
1.0941 times |
Fri 28 February 2025 |
17.97 (6.14%) |
17.37 |
17.19 - 19.80 |
0.9834 times |

DMA SMA EMA moving averages of Gold Fields GFI
DMA (daily moving average) of Gold Fields GFI
| DMA period | DMA value | | 5 day DMA | 41.75 | | 12 day DMA | 41.09 | | 20 day DMA | 41.05 | | 35 day DMA | 40.27 | | 50 day DMA | 40.91 | | 100 day DMA | 36.47 | | 150 day DMA | 32.1 | | 200 day DMA | 29.48 | EMA (exponential moving average) of Gold Fields GFI
| EMA period | EMA current | EMA prev | EMA prev2 | | 5 day EMA | 41.75 | 41.53 | 41.49 | | 12 day EMA | 41.35 | 41.2 | 41.12 | | 20 day EMA | 41.02 | 40.9 | 40.82 | | 35 day EMA | 41.07 | 41 | 40.96 | | 50 day EMA | 41 | 40.95 | 40.92 |
SMA (simple moving average) of Gold Fields GFI
| SMA period | SMA current | SMA prev | SMA prev2 | | 5 day SMA | 41.75 | 41.89 | 42.21 | | 12 day SMA | 41.09 | 40.9 | 40.71 | | 20 day SMA | 41.05 | 40.83 | 40.65 | | 35 day SMA | 40.27 | 40.41 | 40.47 | | 50 day SMA | 40.91 | 40.85 | 40.82 | | 100 day SMA | 36.47 | 36.28 | 36.11 | | 150 day SMA | 32.1 | 31.96 | 31.83 | | 200 day SMA | 29.48 | 29.36 | 29.25 |
|
|
