GriffonCorporation GFF full analysis,charts,indicators,moving averages,SMA,DMA,EMA,ADX,MACD,RSIGriffon Corporation GFF WideScreen charts, DMA,SMA,EMA technical analysis, forecast prediction, by indicators ADX,MACD,RSI,CCI NYSE stock exchange
operates under Capital Goods sector & deals in Building Products
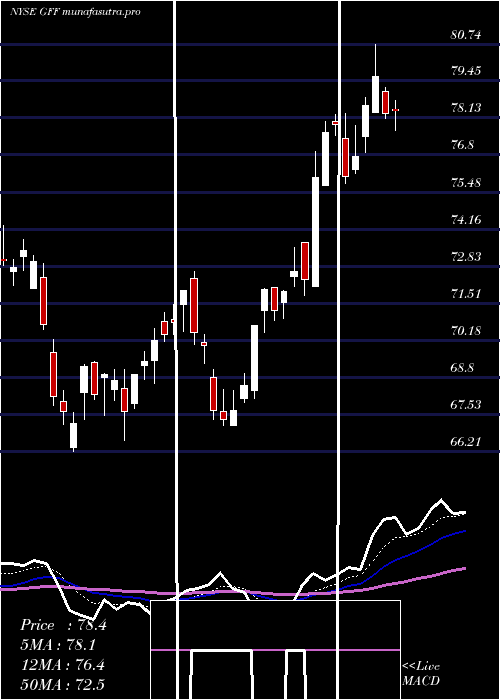
Daily price and charts and targets GriffonCorporation Strong Daily Stock price targets for GriffonCorporation GFF are 72.35 and 74.11 | Daily Target 1 | 72.05 | | Daily Target 2 | 72.65 | | Daily Target 3 | 73.81 | | Daily Target 4 | 74.41 | | Daily Target 5 | 75.57 |
Daily price and volume Griffon Corporation
| Date |
Closing |
Open |
Range |
Volume |
Thu 04 December 2025 |
73.25 (-1.77%) |
74.09 |
73.21 - 74.97 |
0.6028 times |
Wed 03 December 2025 |
74.57 (0.85%) |
74.04 |
73.76 - 74.74 |
0.6361 times |
Tue 02 December 2025 |
73.94 (-0.19%) |
74.88 |
73.14 - 74.88 |
0.5294 times |
Mon 01 December 2025 |
74.08 (-1.23%) |
73.81 |
73.78 - 75.51 |
0.7259 times |
Fri 28 November 2025 |
75.00 (-0.23%) |
75.51 |
74.58 - 75.71 |
0.3972 times |
Wed 26 November 2025 |
75.17 (-0.28%) |
74.66 |
74.46 - 76.07 |
1.4285 times |
Tue 25 November 2025 |
75.38 (4.99%) |
72.15 |
71.75 - 75.72 |
1.0865 times |
Mon 24 November 2025 |
71.80 (-0.47%) |
72.12 |
70.39 - 73.14 |
1.1783 times |
Fri 21 November 2025 |
72.14 (6.09%) |
68.55 |
68.00 - 72.78 |
1.8513 times |
Thu 20 November 2025 |
68.00 (-1.81%) |
69.39 |
66.97 - 70.07 |
1.5639 times |
Wed 19 November 2025 |
69.25 (3.57%) |
70.91 |
65.74 - 72.53 |
2.3106 times |
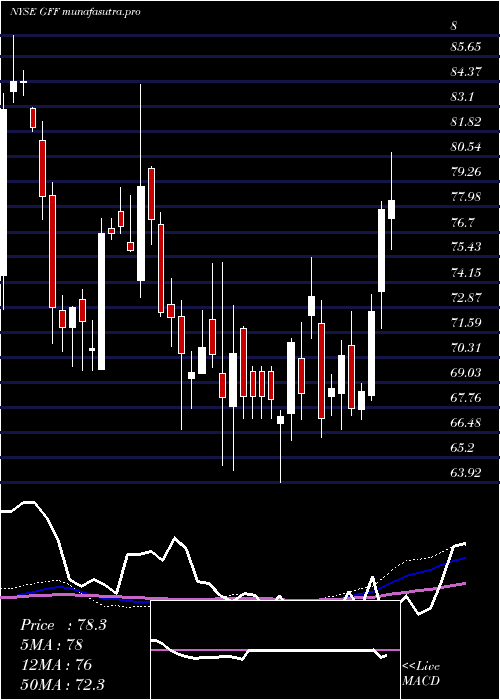
Weekly price and charts GriffonCorporation Strong weekly Stock price targets for GriffonCorporation GFF are 72.01 and 74.38 | Weekly Target 1 | 71.6 | | Weekly Target 2 | 72.42 | | Weekly Target 3 | 73.966666666667 | | Weekly Target 4 | 74.79 | | Weekly Target 5 | 76.34 |
Weekly price and volumes for Griffon Corporation
| Date |
Closing |
Open |
Range |
Volume |
Thu 04 December 2025 |
73.25 (-2.33%) |
73.81 |
73.14 - 75.51 |
0.6903 times |
Fri 28 November 2025 |
75.00 (3.96%) |
72.12 |
70.39 - 76.07 |
1.132 times |
Fri 21 November 2025 |
72.14 (3.25%) |
69.87 |
65.01 - 72.78 |
2.3038 times |
Fri 14 November 2025 |
69.87 (-3.16%) |
72.55 |
69.67 - 72.99 |
1.0754 times |
Fri 07 November 2025 |
72.15 (-2.51%) |
74.86 |
70.70 - 75.04 |
0.9369 times |
Fri 31 October 2025 |
74.01 (0%) |
74.19 |
73.78 - 75.25 |
0.2087 times |
Fri 31 October 2025 |
74.01 (-3.13%) |
76.51 |
73.78 - 78.26 |
1.0373 times |
Fri 24 October 2025 |
76.40 (2.51%) |
74.79 |
74.35 - 77.77 |
0.7985 times |
Fri 17 October 2025 |
74.53 (1.19%) |
74.31 |
72.06 - 76.18 |
0.917 times |
Fri 10 October 2025 |
73.65 (-5.37%) |
78.63 |
73.47 - 78.63 |
0.8999 times |
Fri 03 October 2025 |
77.83 (2.95%) |
75.97 |
74.89 - 79.23 |
0.8097 times |
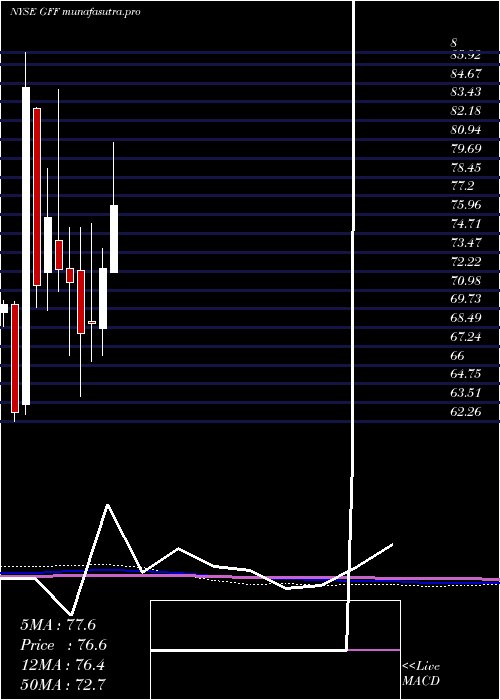
Monthly price and charts GriffonCorporation Strong monthly Stock price targets for GriffonCorporation GFF are 72.01 and 74.38 | Monthly Target 1 | 71.6 | | Monthly Target 2 | 72.42 | | Monthly Target 3 | 73.966666666667 | | Monthly Target 4 | 74.79 | | Monthly Target 5 | 76.34 |
Monthly price and volumes Griffon Corporation
| Date |
Closing |
Open |
Range |
Volume |
Thu 04 December 2025 |
73.25 (-2.33%) |
73.81 |
73.14 - 75.51 |
0.1266 times |
Fri 28 November 2025 |
75.00 (1.34%) |
74.86 |
65.01 - 76.07 |
0.9996 times |
Fri 31 October 2025 |
74.01 (-2.81%) |
75.88 |
72.06 - 79.23 |
0.7919 times |
Tue 30 September 2025 |
76.15 (-0.01%) |
75.71 |
74.62 - 82.23 |
0.8934 times |
Fri 29 August 2025 |
76.16 (-6.29%) |
80.09 |
66.95 - 82.37 |
1.6738 times |
Thu 31 July 2025 |
81.27 (12.3%) |
72.12 |
72.12 - 83.63 |
0.9408 times |
Mon 30 June 2025 |
72.37 (5.27%) |
68.46 |
66.63 - 73.69 |
0.9055 times |
Fri 30 May 2025 |
68.75 (0.94%) |
68.89 |
66.21 - 75.41 |
1.1548 times |
Wed 30 April 2025 |
68.11 (-4.74%) |
72.27 |
63.92 - 75.14 |
1.3159 times |
Mon 31 March 2025 |
71.50 (-1.16%) |
72.41 |
66.65 - 75.12 |
1.1977 times |
Fri 28 February 2025 |
72.34 (-4.53%) |
74.22 |
70.88 - 84.24 |
1.0056 times |
DMA SMA EMA moving averages of Griffon Corporation GFF
DMA (daily moving average) of Griffon Corporation GFF
| DMA period | DMA value | | 5 day DMA | 74.17 | | 12 day DMA | 72.45 | | 20 day DMA | 71.78 | | 35 day DMA | 73.24 | | 50 day DMA | 73.98 | | 100 day DMA | 75.5 | | 150 day DMA | 74.23 | | 200 day DMA | 73.19 | EMA (exponential moving average) of Griffon Corporation GFF
| EMA period | EMA current | EMA prev | EMA prev2 | | 5 day EMA | 73.83 | 74.12 | 73.89 | | 12 day EMA | 73.15 | 73.13 | 72.87 | | 20 day EMA | 72.94 | 72.91 | 72.73 | | 35 day EMA | 73.3 | 73.3 | 73.22 | | 50 day EMA | 74.17 | 74.21 | 74.2 |
SMA (simple moving average) of Griffon Corporation GFF
| SMA period | SMA current | SMA prev | SMA prev2 | | 5 day SMA | 74.17 | 74.55 | 74.71 | | 12 day SMA | 72.45 | 71.92 | 71.52 | | 20 day SMA | 71.78 | 71.79 | 71.75 | | 35 day SMA | 73.24 | 73.31 | 73.32 | | 50 day SMA | 73.98 | 74.03 | 74.08 | | 100 day SMA | 75.5 | 75.54 | 75.58 | | 150 day SMA | 74.23 | 74.19 | 74.15 | | 200 day SMA | 73.19 | 73.21 | 73.22 |
|
|
