GabelliDividend GDV-H full analysis,charts,indicators,moving averages,SMA,DMA,EMA,ADX,MACD,RSIGabelli Dividend GDV-H WideScreen charts, DMA,SMA,EMA technical analysis, forecast prediction, by indicators ADX,MACD,RSI,CCI NYSE stock exchange
Daily price and charts and targets GabelliDividend Strong Daily Stock price targets for GabelliDividend GDV-H are 22.63 and 22.74 | Daily Target 1 | 22.61 | | Daily Target 2 | 22.65 | | Daily Target 3 | 22.716666666667 | | Daily Target 4 | 22.76 | | Daily Target 5 | 22.83 |
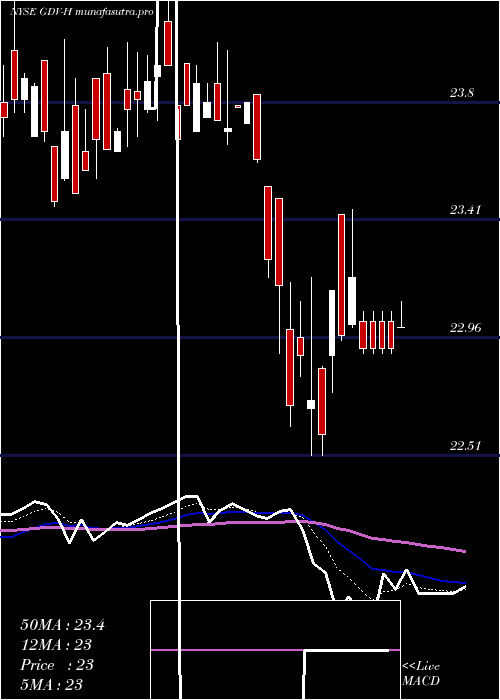
Daily price and volume Gabelli Dividend
| Date |
Closing |
Open |
Range |
Volume |
Fri 05 December 2025 |
22.70 (0.35%) |
22.78 |
22.67 - 22.78 |
0.4059 times |
Thu 04 December 2025 |
22.62 (-0.96%) |
22.96 |
22.61 - 22.96 |
2.5461 times |
Wed 03 December 2025 |
22.84 (-0.17%) |
22.92 |
22.80 - 22.92 |
1.1808 times |
Tue 02 December 2025 |
22.88 (0%) |
22.96 |
22.88 - 22.99 |
0.7749 times |
Mon 01 December 2025 |
22.88 (-0.13%) |
22.91 |
22.84 - 22.98 |
0.5535 times |
Fri 28 November 2025 |
22.91 (-0.26%) |
22.86 |
22.86 - 23.05 |
0.9594 times |
Wed 26 November 2025 |
22.97 (0.13%) |
22.95 |
22.92 - 22.97 |
0.1476 times |
Tue 25 November 2025 |
22.94 (0%) |
22.91 |
22.91 - 22.94 |
0.2952 times |
Mon 24 November 2025 |
22.94 (0.22%) |
22.93 |
22.85 - 22.95 |
1.8081 times |
Fri 21 November 2025 |
22.89 (0.44%) |
22.85 |
22.85 - 22.92 |
1.3284 times |
Thu 20 November 2025 |
22.79 (-0.18%) |
22.83 |
22.79 - 22.88 |
1.2177 times |
Weekly price and charts GabelliDividend Strong weekly Stock price targets for GabelliDividend GDV-H are 22.47 and 22.85 | Weekly Target 1 | 22.39 | | Weekly Target 2 | 22.54 | | Weekly Target 3 | 22.766666666667 | | Weekly Target 4 | 22.92 | | Weekly Target 5 | 23.15 |
Weekly price and volumes for Gabelli Dividend
| Date |
Closing |
Open |
Range |
Volume |
Fri 05 December 2025 |
22.70 (-0.92%) |
22.91 |
22.61 - 22.99 |
0.9913 times |
Fri 28 November 2025 |
22.91 (0.09%) |
22.93 |
22.85 - 23.05 |
0.5827 times |
Fri 21 November 2025 |
22.89 (-0.09%) |
22.90 |
22.70 - 22.92 |
0.8573 times |
Fri 14 November 2025 |
22.91 (-0.61%) |
23.04 |
22.70 - 23.12 |
1.5472 times |
Fri 07 November 2025 |
23.05 (0.13%) |
22.98 |
22.64 - 23.05 |
1.6611 times |
Fri 31 October 2025 |
23.02 (0%) |
23.14 |
23.02 - 23.15 |
0.067 times |
Fri 31 October 2025 |
23.02 (-0.3%) |
23.01 |
22.81 - 23.28 |
1.7348 times |
Fri 24 October 2025 |
23.09 (0.61%) |
22.98 |
22.98 - 23.30 |
0.9243 times |
Fri 17 October 2025 |
22.95 (0.53%) |
22.91 |
22.72 - 22.98 |
0.509 times |
Fri 10 October 2025 |
22.83 (-1.17%) |
23.07 |
22.81 - 23.21 |
1.1253 times |
Fri 03 October 2025 |
23.10 (-0.13%) |
23.02 |
22.91 - 23.22 |
0.4354 times |

Monthly price and charts GabelliDividend Strong monthly Stock price targets for GabelliDividend GDV-H are 22.47 and 22.85 | Monthly Target 1 | 22.39 | | Monthly Target 2 | 22.54 | | Monthly Target 3 | 22.766666666667 | | Monthly Target 4 | 22.92 | | Monthly Target 5 | 23.15 |
Monthly price and volumes Gabelli Dividend
| Date |
Closing |
Open |
Range |
Volume |
Fri 05 December 2025 |
22.70 (-0.92%) |
22.91 |
22.61 - 22.99 |
0.2676 times |
Fri 28 November 2025 |
22.91 (-0.48%) |
22.98 |
22.64 - 23.12 |
1.2548 times |
Fri 31 October 2025 |
23.02 (-0.39%) |
22.91 |
22.72 - 23.30 |
1.2403 times |
Tue 30 September 2025 |
23.11 (0.26%) |
23.04 |
22.93 - 23.74 |
0.6834 times |
Fri 29 August 2025 |
23.05 (0.3%) |
23.03 |
22.85 - 23.34 |
0.5261 times |
Thu 31 July 2025 |
22.98 (1.01%) |
23.05 |
22.70 - 23.36 |
0.8301 times |
Mon 30 June 2025 |
22.75 (-0.44%) |
22.75 |
22.35 - 23.26 |
1.3868 times |
Fri 30 May 2025 |
22.85 (-0.7%) |
23.01 |
22.78 - 23.41 |
1.4193 times |
Wed 30 April 2025 |
23.01 (-3.48%) |
23.78 |
22.51 - 23.89 |
1.6554 times |
Mon 31 March 2025 |
23.84 (0.38%) |
23.69 |
23.46 - 24.50 |
0.7362 times |
Fri 28 February 2025 |
23.75 (2.41%) |
23.19 |
22.85 - 24.31 |
1.3542 times |

DMA SMA EMA moving averages of Gabelli Dividend GDV-H
DMA (daily moving average) of Gabelli Dividend GDV-H
| DMA period | DMA value | | 5 day DMA | 22.78 | | 12 day DMA | 22.85 | | 20 day DMA | 22.89 | | 35 day DMA | 22.97 | | 50 day DMA | 22.98 | | 100 day DMA | 23.06 | | 150 day DMA | 23.02 | | 200 day DMA | 23.13 | EMA (exponential moving average) of Gabelli Dividend GDV-H
| EMA period | EMA current | EMA prev | EMA prev2 | | 5 day EMA | 22.76 | 22.79 | 22.88 | | 12 day EMA | 22.84 | 22.86 | 22.9 | | 20 day EMA | 22.87 | 22.89 | 22.92 | | 35 day EMA | 22.93 | 22.94 | 22.96 | | 50 day EMA | 22.97 | 22.98 | 22.99 |
SMA (simple moving average) of Gabelli Dividend GDV-H
| SMA period | SMA current | SMA prev | SMA prev2 | | 5 day SMA | 22.78 | 22.83 | 22.9 | | 12 day SMA | 22.85 | 22.86 | 22.88 | | 20 day SMA | 22.89 | 22.9 | 22.92 | | 35 day SMA | 22.97 | 22.97 | 22.98 | | 50 day SMA | 22.98 | 22.99 | 22.99 | | 100 day SMA | 23.06 | 23.07 | 23.07 | | 150 day SMA | 23.02 | 23.02 | 23.02 | | 200 day SMA | 23.13 | 23.13 | 23.14 |
|
|
