GreenDot GDOT full analysis,charts,indicators,moving averages,SMA,DMA,EMA,ADX,MACD,RSIGreen Dot GDOT WideScreen charts, DMA,SMA,EMA technical analysis, forecast prediction, by indicators ADX,MACD,RSI,CCI NYSE stock exchange
operates under Finance sector & deals in Finance Consumer Services
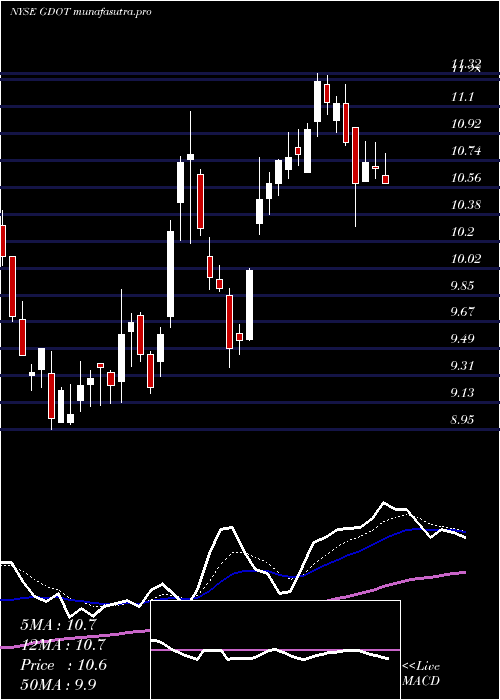
Daily price and charts and targets GreenDot Strong Daily Stock price targets for GreenDot GDOT are 13.04 and 13.35 | Daily Target 1 | 12.98 | | Daily Target 2 | 13.09 | | Daily Target 3 | 13.286666666667 | | Daily Target 4 | 13.4 | | Daily Target 5 | 13.6 |
Daily price and volume Green Dot
| Date |
Closing |
Open |
Range |
Volume |
Thu 04 December 2025 |
13.21 (0.15%) |
13.25 |
13.17 - 13.48 |
0.6515 times |
Wed 03 December 2025 |
13.19 (1.31%) |
13.13 |
13.07 - 13.39 |
0.7494 times |
Tue 02 December 2025 |
13.02 (4.08%) |
12.55 |
12.51 - 13.06 |
0.8132 times |
Mon 01 December 2025 |
12.51 (-0.48%) |
12.35 |
12.35 - 12.80 |
1.3616 times |
Fri 28 November 2025 |
12.57 (2.2%) |
12.37 |
12.23 - 12.69 |
0.6046 times |
Wed 26 November 2025 |
12.30 (3.97%) |
11.81 |
11.76 - 12.55 |
1.246 times |
Tue 25 November 2025 |
11.83 (0.17%) |
11.54 |
11.43 - 12.24 |
1.6328 times |
Mon 24 November 2025 |
11.81 (0.08%) |
12.60 |
11.29 - 12.60 |
1.7666 times |
Fri 21 November 2025 |
11.80 (7.76%) |
11.05 |
10.98 - 11.84 |
0.5251 times |
Thu 20 November 2025 |
10.95 (1.96%) |
10.90 |
10.73 - 11.18 |
0.6491 times |
Wed 19 November 2025 |
10.74 (1.7%) |
10.53 |
10.46 - 10.80 |
0.39 times |
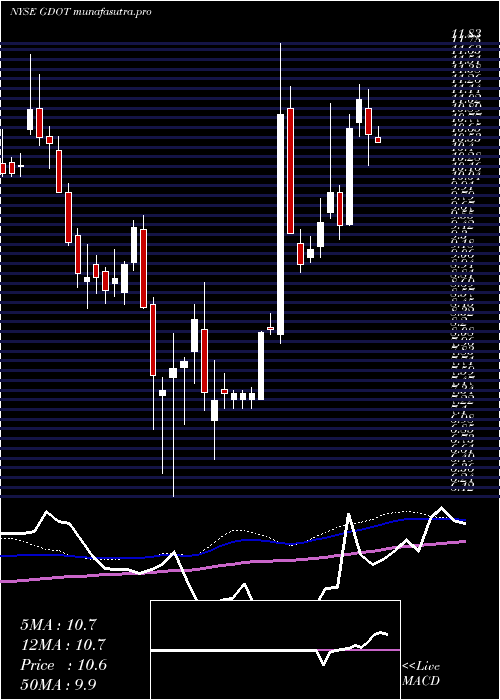
Weekly price and charts GreenDot Strong weekly Stock price targets for GreenDot GDOT are 12.78 and 13.91 | Weekly Target 1 | 11.88 | | Weekly Target 2 | 12.55 | | Weekly Target 3 | 13.013333333333 | | Weekly Target 4 | 13.68 | | Weekly Target 5 | 14.14 |
Weekly price and volumes for Green Dot
| Date |
Closing |
Open |
Range |
Volume |
Thu 04 December 2025 |
13.21 (5.09%) |
12.35 |
12.35 - 13.48 |
1.6549 times |
Fri 28 November 2025 |
12.57 (6.53%) |
12.60 |
11.29 - 12.69 |
2.4298 times |
Fri 21 November 2025 |
11.80 (8.86%) |
10.86 |
10.42 - 11.84 |
1.108 times |
Fri 14 November 2025 |
10.84 (-6.23%) |
11.84 |
10.10 - 12.05 |
1.2288 times |
Fri 07 November 2025 |
11.56 (-0.43%) |
11.46 |
11.44 - 12.19 |
0.5521 times |
Fri 31 October 2025 |
11.61 (0%) |
11.84 |
11.46 - 11.86 |
0.1562 times |
Fri 31 October 2025 |
11.61 (-11.24%) |
13.20 |
11.46 - 13.23 |
0.5914 times |
Fri 24 October 2025 |
13.08 (5.06%) |
12.53 |
12.42 - 13.23 |
0.7075 times |
Fri 17 October 2025 |
12.45 (0.08%) |
12.57 |
11.93 - 12.79 |
0.9282 times |
Fri 10 October 2025 |
12.44 (-4.82%) |
13.19 |
12.30 - 13.27 |
0.643 times |
Fri 03 October 2025 |
13.07 (-7.96%) |
14.36 |
12.87 - 14.46 |
1.1047 times |
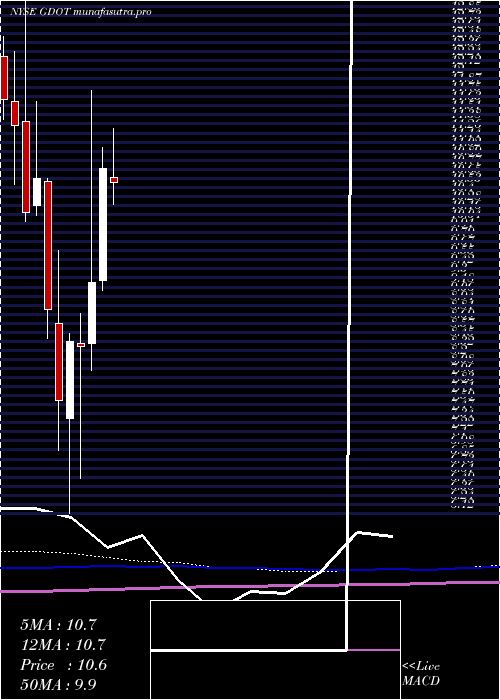
Monthly price and charts GreenDot Strong monthly Stock price targets for GreenDot GDOT are 12.78 and 13.91 | Monthly Target 1 | 11.88 | | Monthly Target 2 | 12.55 | | Monthly Target 3 | 13.013333333333 | | Monthly Target 4 | 13.68 | | Monthly Target 5 | 14.14 |
Monthly price and volumes Green Dot
| Date |
Closing |
Open |
Range |
Volume |
Thu 04 December 2025 |
13.21 (5.09%) |
12.35 |
12.35 - 13.48 |
0.3515 times |
Fri 28 November 2025 |
12.57 (8.27%) |
11.46 |
10.10 - 12.69 |
1.1295 times |
Fri 31 October 2025 |
11.61 (-13.55%) |
13.39 |
11.46 - 13.69 |
0.7528 times |
Tue 30 September 2025 |
13.43 (-3.52%) |
13.66 |
13.22 - 15.41 |
1.0423 times |
Fri 29 August 2025 |
13.92 (37.55%) |
9.93 |
9.31 - 14.27 |
1.099 times |
Thu 31 July 2025 |
10.12 (-6.12%) |
10.66 |
10.00 - 11.32 |
0.8366 times |
Mon 30 June 2025 |
10.78 (16.67%) |
9.27 |
9.13 - 11.07 |
0.814 times |
Fri 30 May 2025 |
9.24 (10.39%) |
8.41 |
8.05 - 11.83 |
1.1364 times |
Wed 30 April 2025 |
8.37 (-0.83%) |
8.42 |
6.59 - 8.82 |
0.8532 times |
Mon 31 March 2025 |
8.44 (10.33%) |
7.40 |
6.12 - 8.55 |
1.9848 times |
Fri 28 February 2025 |
7.65 (-13.75%) |
8.69 |
6.97 - 9.67 |
0.579 times |
DMA SMA EMA moving averages of Green Dot GDOT
DMA (daily moving average) of Green Dot GDOT
| DMA period | DMA value | | 5 day DMA | 12.9 | | 12 day DMA | 12.04 | | 20 day DMA | 11.74 | | 35 day DMA | 12.02 | | 50 day DMA | 12.33 | | 100 day DMA | 12.46 | | 150 day DMA | 11.6 | | 200 day DMA | 10.64 | EMA (exponential moving average) of Green Dot GDOT
| EMA period | EMA current | EMA prev | EMA prev2 | | 5 day EMA | 12.88 | 12.71 | 12.47 | | 12 day EMA | 12.36 | 12.2 | 12.02 | | 20 day EMA | 12.17 | 12.06 | 11.94 | | 35 day EMA | 12.28 | 12.23 | 12.17 | | 50 day EMA | 12.6 | 12.58 | 12.55 |
SMA (simple moving average) of Green Dot GDOT
| SMA period | SMA current | SMA prev | SMA prev2 | | 5 day SMA | 12.9 | 12.72 | 12.45 | | 12 day SMA | 12.04 | 11.82 | 11.63 | | 20 day SMA | 11.74 | 11.69 | 11.61 | | 35 day SMA | 12.02 | 12.01 | 11.99 | | 50 day SMA | 12.33 | 12.36 | 12.39 | | 100 day SMA | 12.46 | 12.43 | 12.4 | | 150 day SMA | 11.6 | 11.57 | 11.54 | | 200 day SMA | 10.64 | 10.62 | 10.6 |
|
|
