WesternAsset GDO full analysis,charts,indicators,moving averages,SMA,DMA,EMA,ADX,MACD,RSIWestern Asset GDO WideScreen charts, DMA,SMA,EMA technical analysis, forecast prediction, by indicators ADX,MACD,RSI,CCI NYSE stock exchange
operates under N A sector & deals in N A
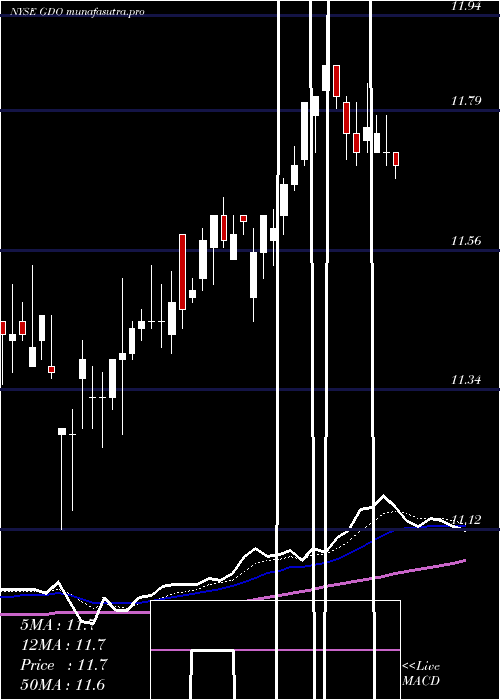
Daily price and charts and targets WesternAsset Strong Daily Stock price targets for WesternAsset GDO are 11.78 and 11.97 | Daily Target 1 | 11.64 | | Daily Target 2 | 11.72 | | Daily Target 3 | 11.83 | | Daily Target 4 | 11.91 | | Daily Target 5 | 12.02 |
Daily price and volume Western Asset
| Date |
Closing |
Open |
Range |
Volume |
Mon 20 October 2025 |
11.80 (0.17%) |
11.75 |
11.75 - 11.94 |
1.1403 times |
Fri 17 October 2025 |
11.78 (-0.76%) |
11.95 |
11.68 - 11.95 |
1.5237 times |
Thu 16 October 2025 |
11.87 (0.25%) |
11.86 |
11.85 - 11.92 |
0.4541 times |
Wed 15 October 2025 |
11.84 (0%) |
11.78 |
11.78 - 11.95 |
0.9637 times |
Tue 14 October 2025 |
11.84 (0%) |
11.79 |
11.75 - 12.00 |
1.2008 times |
Mon 13 October 2025 |
11.84 (-0.08%) |
11.85 |
11.80 - 12.02 |
0.6155 times |
Fri 10 October 2025 |
11.85 (-0.17%) |
11.88 |
11.85 - 11.96 |
0.8022 times |
Thu 09 October 2025 |
11.87 (-1.33%) |
12.03 |
11.84 - 12.09 |
1.8113 times |
Wed 08 October 2025 |
12.03 (-0.17%) |
12.06 |
12.03 - 12.08 |
0.555 times |
Tue 07 October 2025 |
12.05 (0.5%) |
12.05 |
11.97 - 12.11 |
0.9334 times |
Mon 06 October 2025 |
11.99 (-0.66%) |
12.06 |
11.98 - 12.14 |
2.3522 times |
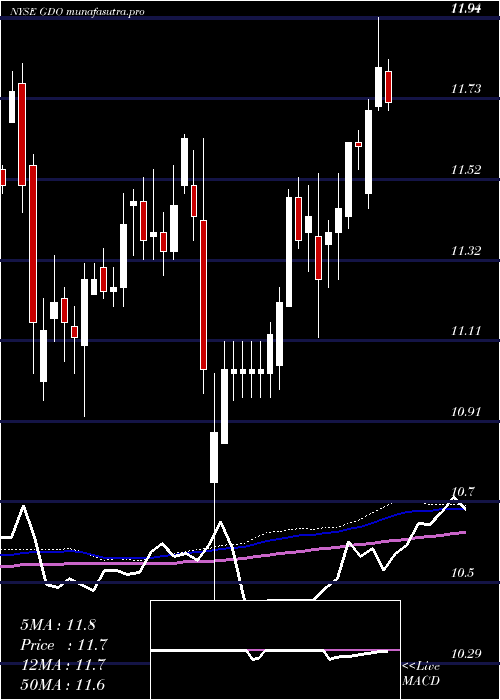
Weekly price and charts WesternAsset Strong weekly Stock price targets for WesternAsset GDO are 11.78 and 11.97 | Weekly Target 1 | 11.64 | | Weekly Target 2 | 11.72 | | Weekly Target 3 | 11.83 | | Weekly Target 4 | 11.91 | | Weekly Target 5 | 12.02 |
Weekly price and volumes for Western Asset
| Date |
Closing |
Open |
Range |
Volume |
Mon 20 October 2025 |
11.80 (0.17%) |
11.75 |
11.75 - 11.94 |
0.1777 times |
Fri 17 October 2025 |
11.78 (-0.59%) |
11.85 |
11.68 - 12.02 |
0.7416 times |
Fri 10 October 2025 |
11.85 (-1.82%) |
12.06 |
11.84 - 12.14 |
1.006 times |
Fri 03 October 2025 |
12.07 (1.34%) |
12.01 |
11.83 - 12.11 |
1.3842 times |
Fri 26 September 2025 |
11.91 (-1.33%) |
12.08 |
11.85 - 12.15 |
0.9839 times |
Fri 19 September 2025 |
12.07 (0.58%) |
12.02 |
11.99 - 12.12 |
1.7215 times |
Fri 12 September 2025 |
12.00 (0.67%) |
11.92 |
11.89 - 12.00 |
1.5572 times |
Fri 05 September 2025 |
11.92 (-0.58%) |
11.96 |
11.85 - 11.98 |
0.8163 times |
Fri 29 August 2025 |
11.99 (0%) |
11.95 |
11.94 - 12.01 |
0.2422 times |
Fri 29 August 2025 |
11.99 (0.25%) |
11.97 |
11.90 - 12.01 |
1.3692 times |
Fri 22 August 2025 |
11.96 (-0.17%) |
11.98 |
11.93 - 12.10 |
1.7554 times |
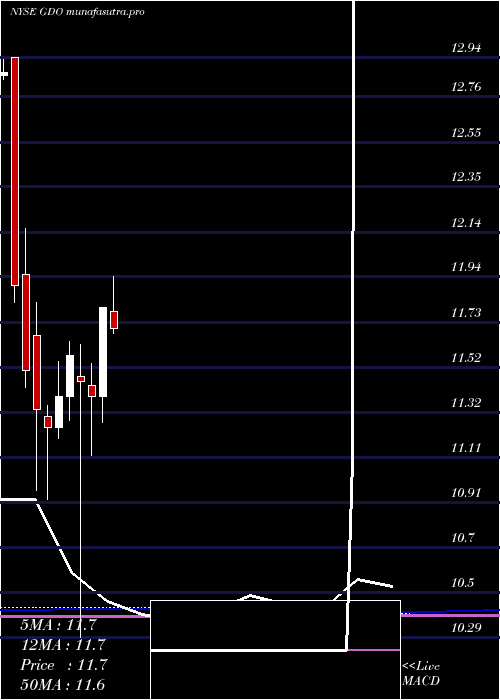
Monthly price and charts WesternAsset Strong monthly Stock price targets for WesternAsset GDO are 11.51 and 11.97 | Monthly Target 1 | 11.41 | | Monthly Target 2 | 11.61 | | Monthly Target 3 | 11.873333333333 | | Monthly Target 4 | 12.07 | | Monthly Target 5 | 12.33 |
Monthly price and volumes Western Asset
| Date |
Closing |
Open |
Range |
Volume |
Mon 20 October 2025 |
11.80 (-0.67%) |
11.92 |
11.68 - 12.14 |
0.5401 times |
Tue 30 September 2025 |
11.88 (-0.92%) |
11.96 |
11.83 - 12.15 |
1.1081 times |
Fri 29 August 2025 |
11.99 (2.13%) |
11.79 |
11.73 - 12.10 |
1.1527 times |
Thu 31 July 2025 |
11.74 (-0.51%) |
11.78 |
11.56 - 11.94 |
1.076 times |
Mon 30 June 2025 |
11.80 (3.6%) |
11.39 |
11.27 - 11.80 |
0.996 times |
Fri 30 May 2025 |
11.39 (-0.61%) |
11.44 |
11.12 - 11.54 |
0.8543 times |
Wed 30 April 2025 |
11.46 (-1.04%) |
11.48 |
10.29 - 11.63 |
1.0613 times |
Mon 31 March 2025 |
11.58 (1.67%) |
11.39 |
11.28 - 11.64 |
1.1022 times |
Fri 28 February 2025 |
11.39 (1.24%) |
11.25 |
11.20 - 11.55 |
0.9146 times |
Fri 31 January 2025 |
11.25 (-0.71%) |
11.30 |
10.92 - 11.35 |
1.1946 times |
Tue 31 December 2024 |
11.33 (-1.56%) |
11.67 |
10.96 - 11.82 |
1.6777 times |
DMA SMA EMA moving averages of Western Asset GDO
DMA (daily moving average) of Western Asset GDO
| DMA period | DMA value | | 5 day DMA | 11.83 | | 12 day DMA | 11.9 | | 20 day DMA | 11.92 | | 35 day DMA | 11.94 | | 50 day DMA | 11.96 | | 100 day DMA | 11.8 | | 150 day DMA | 11.63 | | 200 day DMA | 11.55 | EMA (exponential moving average) of Western Asset GDO
| EMA period | EMA current | EMA prev | EMA prev2 | | 5 day EMA | 11.83 | 11.84 | 11.87 | | 12 day EMA | 11.87 | 11.88 | 11.9 | | 20 day EMA | 11.91 | 11.92 | 11.93 | | 35 day EMA | 11.9 | 11.91 | 11.92 | | 50 day EMA | 11.94 | 11.95 | 11.96 |
SMA (simple moving average) of Western Asset GDO
| SMA period | SMA current | SMA prev | SMA prev2 | | 5 day SMA | 11.83 | 11.83 | 11.85 | | 12 day SMA | 11.9 | 11.92 | 11.93 | | 20 day SMA | 11.92 | 11.93 | 11.95 | | 35 day SMA | 11.94 | 11.95 | 11.96 | | 50 day SMA | 11.96 | 11.96 | 11.96 | | 100 day SMA | 11.8 | 11.8 | 11.79 | | 150 day SMA | 11.63 | 11.62 | 11.62 | | 200 day SMA | 11.55 | 11.55 | 11.55 |
|
|
