GreenbrierCompanies GBX full analysis,charts,indicators,moving averages,SMA,DMA,EMA,ADX,MACD,RSIGreenbrier Companies GBX WideScreen charts, DMA,SMA,EMA technical analysis, forecast prediction, by indicators ADX,MACD,RSI,CCI NYSE stock exchange
operates under Capital Goods sector & deals in Railroads
Daily price and charts and targets GreenbrierCompanies Strong Daily Stock price targets for GreenbrierCompanies GBX are 46.33 and 47.53 | Daily Target 1 | 45.47 | | Daily Target 2 | 45.99 | | Daily Target 3 | 46.67 | | Daily Target 4 | 47.19 | | Daily Target 5 | 47.87 |
Daily price and volume Greenbrier Companies
| Date |
Closing |
Open |
Range |
Volume |
Thu 04 December 2025 |
46.51 (1.06%) |
46.15 |
46.15 - 47.35 |
1.3533 times |
Wed 03 December 2025 |
46.02 (2.09%) |
45.35 |
45.22 - 46.29 |
1.1473 times |
Tue 02 December 2025 |
45.08 (0.87%) |
45.08 |
44.48 - 45.12 |
0.9636 times |
Mon 01 December 2025 |
44.69 (0.47%) |
44.38 |
44.36 - 45.13 |
0.9076 times |
Fri 28 November 2025 |
44.48 (-0.43%) |
44.91 |
44.36 - 45.03 |
0.4187 times |
Wed 26 November 2025 |
44.67 (0.77%) |
44.30 |
44.30 - 45.17 |
1.2032 times |
Tue 25 November 2025 |
44.33 (2.45%) |
43.54 |
43.37 - 44.68 |
0.989 times |
Mon 24 November 2025 |
43.27 (-0.41%) |
43.09 |
42.99 - 43.64 |
0.8617 times |
Fri 21 November 2025 |
43.45 (3.04%) |
41.27 |
41.27 - 43.91 |
1.3244 times |
Thu 20 November 2025 |
42.17 (0.38%) |
42.19 |
42.03 - 42.89 |
0.8312 times |
Wed 19 November 2025 |
42.01 (-0.17%) |
42.23 |
41.81 - 42.48 |
1.5092 times |
Weekly price and charts GreenbrierCompanies Strong weekly Stock price targets for GreenbrierCompanies GBX are 45.44 and 48.43 | Weekly Target 1 | 43.08 | | Weekly Target 2 | 44.8 | | Weekly Target 3 | 46.073333333333 | | Weekly Target 4 | 47.79 | | Weekly Target 5 | 49.06 |
Weekly price and volumes for Greenbrier Companies
| Date |
Closing |
Open |
Range |
Volume |
Thu 04 December 2025 |
46.51 (4.56%) |
44.38 |
44.36 - 47.35 |
0.7669 times |
Fri 28 November 2025 |
44.48 (2.37%) |
43.09 |
42.99 - 45.17 |
0.6091 times |
Fri 21 November 2025 |
43.45 (1.28%) |
42.62 |
41.27 - 43.91 |
1.0031 times |
Fri 14 November 2025 |
42.90 (-0.39%) |
43.31 |
41.41 - 43.67 |
0.9567 times |
Fri 07 November 2025 |
43.07 (3.11%) |
41.40 |
40.96 - 43.36 |
1.0058 times |
Fri 31 October 2025 |
41.77 (0%) |
41.31 |
40.93 - 42.45 |
0.5264 times |
Fri 31 October 2025 |
41.77 (-9.08%) |
46.33 |
38.23 - 46.33 |
2.7023 times |
Fri 24 October 2025 |
45.94 (1.48%) |
45.80 |
45.19 - 46.43 |
0.6223 times |
Fri 17 October 2025 |
45.27 (3.12%) |
44.50 |
44.31 - 46.55 |
0.7424 times |
Fri 10 October 2025 |
43.90 (-4.63%) |
46.14 |
43.88 - 46.38 |
1.0649 times |
Fri 03 October 2025 |
46.03 (-0.41%) |
46.52 |
45.37 - 47.11 |
0.8638 times |

Monthly price and charts GreenbrierCompanies Strong monthly Stock price targets for GreenbrierCompanies GBX are 45.44 and 48.43 | Monthly Target 1 | 43.08 | | Monthly Target 2 | 44.8 | | Monthly Target 3 | 46.073333333333 | | Monthly Target 4 | 47.79 | | Monthly Target 5 | 49.06 |
Monthly price and volumes Greenbrier Companies
| Date |
Closing |
Open |
Range |
Volume |
Thu 04 December 2025 |
46.51 (4.56%) |
44.38 |
44.36 - 47.35 |
0.1477 times |
Fri 28 November 2025 |
44.48 (6.49%) |
41.40 |
40.96 - 45.17 |
0.6884 times |
Fri 31 October 2025 |
41.77 (-9.53%) |
45.49 |
38.23 - 47.11 |
1.1765 times |
Tue 30 September 2025 |
46.17 (-0.99%) |
45.90 |
44.78 - 47.55 |
0.784 times |
Fri 29 August 2025 |
46.63 (2.48%) |
44.47 |
43.78 - 47.91 |
0.7532 times |
Thu 31 July 2025 |
45.50 (-1.19%) |
45.78 |
44.78 - 57.48 |
2.035 times |
Mon 30 June 2025 |
46.05 (2.17%) |
44.92 |
44.17 - 46.99 |
0.7062 times |
Fri 30 May 2025 |
45.07 (6.25%) |
42.46 |
41.85 - 48.04 |
0.6874 times |
Wed 30 April 2025 |
42.42 (-17.18%) |
50.98 |
37.77 - 52.32 |
2.0137 times |
Mon 31 March 2025 |
51.22 (-8.86%) |
56.63 |
50.20 - 56.63 |
1.0079 times |
Fri 28 February 2025 |
56.20 (-15.18%) |
64.46 |
53.33 - 66.29 |
1.1193 times |

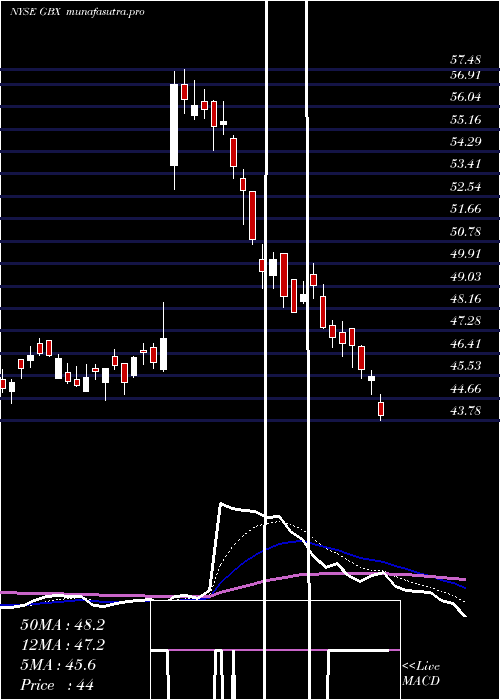
DMA SMA EMA moving averages of Greenbrier Companies GBX
DMA (daily moving average) of Greenbrier Companies GBX
| DMA period | DMA value | | 5 day DMA | 45.36 | | 12 day DMA | 44.06 | | 20 day DMA | 43.47 | | 35 day DMA | 43.73 | | 50 day DMA | 44.28 | | 100 day DMA | 45.42 | | 150 day DMA | 46.02 | | 200 day DMA | 46.87 | EMA (exponential moving average) of Greenbrier Companies GBX
| EMA period | EMA current | EMA prev | EMA prev2 | | 5 day EMA | 45.52 | 45.02 | 44.52 | | 12 day EMA | 44.54 | 44.18 | 43.84 | | 20 day EMA | 44.12 | 43.87 | 43.64 | | 35 day EMA | 44.22 | 44.09 | 43.98 | | 50 day EMA | 44.54 | 44.46 | 44.4 |
SMA (simple moving average) of Greenbrier Companies GBX
| SMA period | SMA current | SMA prev | SMA prev2 | | 5 day SMA | 45.36 | 44.99 | 44.65 | | 12 day SMA | 44.06 | 43.66 | 43.4 | | 20 day SMA | 43.47 | 43.27 | 43.06 | | 35 day SMA | 43.73 | 43.71 | 43.7 | | 50 day SMA | 44.28 | 44.25 | 44.25 | | 100 day SMA | 45.42 | 45.47 | 45.53 | | 150 day SMA | 46.02 | 45.99 | 45.97 | | 200 day SMA | 46.87 | 46.93 | 46.99 |
|
|
