GabelliEquity GAB-G full analysis,charts,indicators,moving averages,SMA,DMA,EMA,ADX,MACD,RSIGabelli Equity GAB-G WideScreen charts, DMA,SMA,EMA technical analysis, forecast prediction, by indicators ADX,MACD,RSI,CCI NYSE stock exchange
Daily price and charts and targets GabelliEquity Strong Daily Stock price targets for GabelliEquity GAB-G are 21.13 and 21.2 | Daily Target 1 | 21.11 | | Daily Target 2 | 21.14 | | Daily Target 3 | 21.183333333333 | | Daily Target 4 | 21.21 | | Daily Target 5 | 21.25 |
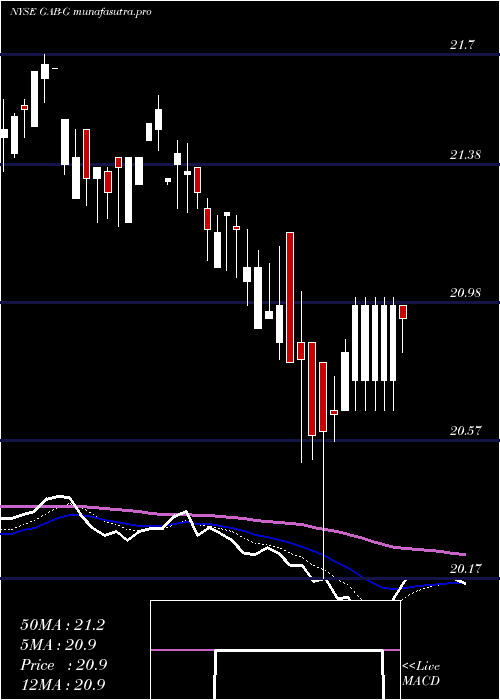
Daily price and volume Gabelli Equity
| Date |
Closing |
Open |
Range |
Volume |
Tue 21 October 2025 |
21.16 (0.05%) |
21.17 |
21.16 - 21.23 |
0.2483 times |
Mon 20 October 2025 |
21.15 (1.1%) |
20.96 |
20.96 - 21.15 |
1.377 times |
Fri 17 October 2025 |
20.92 (-0.05%) |
20.98 |
20.80 - 20.98 |
0.9481 times |
Thu 16 October 2025 |
20.93 (0%) |
20.82 |
20.82 - 20.93 |
0.6546 times |
Wed 15 October 2025 |
20.93 (0.62%) |
20.94 |
20.93 - 21.00 |
0.4289 times |
Tue 14 October 2025 |
20.80 (0%) |
20.77 |
20.77 - 20.80 |
0.0677 times |
Mon 13 October 2025 |
20.80 (-0.48%) |
20.89 |
20.80 - 20.94 |
1.8284 times |
Fri 10 October 2025 |
20.90 (0.19%) |
21.00 |
20.86 - 21.00 |
0.4515 times |
Thu 09 October 2025 |
20.86 (-0.95%) |
21.07 |
20.82 - 21.07 |
1.9413 times |
Wed 08 October 2025 |
21.06 (-0.43%) |
21.15 |
20.91 - 21.15 |
2.0542 times |
Tue 07 October 2025 |
21.15 (-0.42%) |
21.05 |
21.05 - 21.24 |
0.7675 times |
Weekly price and charts GabelliEquity Strong weekly Stock price targets for GabelliEquity GAB-G are 21.06 and 21.33 | Weekly Target 1 | 20.85 | | Weekly Target 2 | 21 | | Weekly Target 3 | 21.116666666667 | | Weekly Target 4 | 21.27 | | Weekly Target 5 | 21.39 |
Weekly price and volumes for Gabelli Equity
| Date |
Closing |
Open |
Range |
Volume |
Tue 21 October 2025 |
21.16 (1.15%) |
20.96 |
20.96 - 21.23 |
0.3758 times |
Fri 17 October 2025 |
20.92 (0.1%) |
20.89 |
20.77 - 21.00 |
0.9081 times |
Fri 10 October 2025 |
20.90 (-1.6%) |
21.29 |
20.82 - 21.29 |
1.3883 times |
Fri 03 October 2025 |
21.24 (0.57%) |
21.13 |
20.96 - 21.30 |
1.1848 times |
Fri 26 September 2025 |
21.12 (-1.45%) |
21.55 |
21.11 - 21.55 |
1.096 times |
Fri 19 September 2025 |
21.43 (-0.23%) |
21.49 |
21.34 - 21.79 |
2.5104 times |
Fri 12 September 2025 |
21.48 (0.99%) |
21.29 |
21.29 - 21.66 |
1.2578 times |
Fri 05 September 2025 |
21.27 (1.67%) |
20.94 |
20.80 - 21.32 |
0.6889 times |
Fri 29 August 2025 |
20.92 (0%) |
20.88 |
20.86 - 20.99 |
0.12 times |
Fri 29 August 2025 |
20.92 (-1.09%) |
21.02 |
20.86 - 21.12 |
0.4697 times |
Fri 22 August 2025 |
21.15 (0.91%) |
20.96 |
20.96 - 21.15 |
0.261 times |

Monthly price and charts GabelliEquity Strong monthly Stock price targets for GabelliEquity GAB-G are 20.97 and 21.5 | Monthly Target 1 | 20.55 | | Monthly Target 2 | 20.85 | | Monthly Target 3 | 21.076666666667 | | Monthly Target 4 | 21.38 | | Monthly Target 5 | 21.61 |
Monthly price and volumes Gabelli Equity
| Date |
Closing |
Open |
Range |
Volume |
Tue 21 October 2025 |
21.16 (0.05%) |
21.14 |
20.77 - 21.30 |
0.6854 times |
Tue 30 September 2025 |
21.15 (1.1%) |
20.94 |
20.80 - 21.79 |
1.3273 times |
Fri 29 August 2025 |
20.92 (1.65%) |
20.63 |
20.63 - 21.40 |
0.662 times |
Thu 31 July 2025 |
20.58 (0.68%) |
20.46 |
20.46 - 20.85 |
0.751 times |
Mon 30 June 2025 |
20.44 (-2.67%) |
21.00 |
20.38 - 21.03 |
0.5749 times |
Fri 30 May 2025 |
21.00 (-0.24%) |
21.11 |
20.66 - 21.45 |
0.8707 times |
Wed 30 April 2025 |
21.05 (-0.89%) |
21.20 |
20.17 - 21.32 |
1.8658 times |
Mon 31 March 2025 |
21.24 (-1.89%) |
21.63 |
21.07 - 21.70 |
0.846 times |
Fri 28 February 2025 |
21.65 (1.41%) |
21.27 |
21.13 - 21.69 |
1.6443 times |
Fri 31 January 2025 |
21.35 (0.95%) |
21.30 |
21.11 - 21.69 |
0.7727 times |
Tue 31 December 2024 |
21.15 (-8.2%) |
22.71 |
20.98 - 22.92 |
1.3819 times |

DMA SMA EMA moving averages of Gabelli Equity GAB-G
DMA (daily moving average) of Gabelli Equity GAB-G
| DMA period | DMA value | | 5 day DMA | 21.02 | | 12 day DMA | 20.99 | | 20 day DMA | 21.07 | | 35 day DMA | 21.21 | | 50 day DMA | 21.16 | | 100 day DMA | 20.94 | | 150 day DMA | 20.99 | | 200 day DMA | 21.09 | EMA (exponential moving average) of Gabelli Equity GAB-G
| EMA period | EMA current | EMA prev | EMA prev2 | | 5 day EMA | 21.05 | 20.99 | 20.91 | | 12 day EMA | 21.03 | 21.01 | 20.99 | | 20 day EMA | 21.08 | 21.07 | 21.06 | | 35 day EMA | 21.07 | 21.06 | 21.05 | | 50 day EMA | 21.1 | 21.1 | 21.1 |
SMA (simple moving average) of Gabelli Equity GAB-G
| SMA period | SMA current | SMA prev | SMA prev2 | | 5 day SMA | 21.02 | 20.95 | 20.88 | | 12 day SMA | 20.99 | 21 | 21 | | 20 day SMA | 21.07 | 21.09 | 21.1 | | 35 day SMA | 21.21 | 21.21 | 21.2 | | 50 day SMA | 21.16 | 21.15 | 21.14 | | 100 day SMA | 20.94 | 20.94 | 20.93 | | 150 day SMA | 20.99 | 20.99 | 20.99 | | 200 day SMA | 21.09 | 21.09 | 21.09 |
|
|
