HB FUL full analysis,charts,indicators,moving averages,SMA,DMA,EMA,ADX,MACD,RSIH B FUL WideScreen charts, DMA,SMA,EMA technical analysis, forecast prediction, by indicators ADX,MACD,RSI,CCI NYSE stock exchange
operates under Basic Industries sector & deals in Home Furnishings
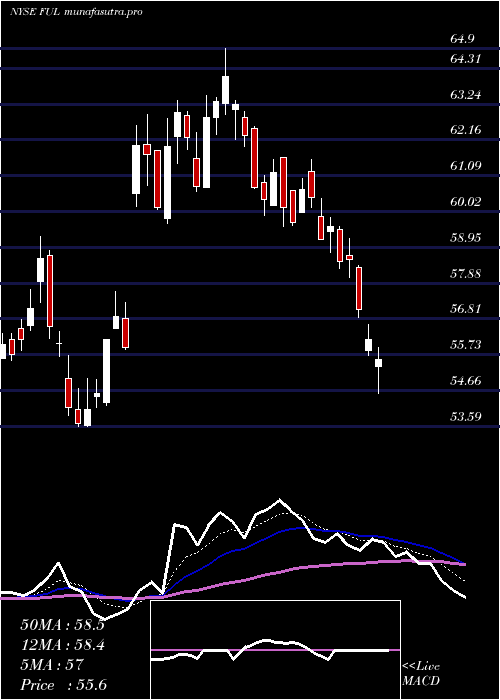
Daily price and charts and targets HB Strong Daily Stock price targets for HB FUL are 59.54 and 61.43 | Daily Target 1 | 58.02 | | Daily Target 2 | 59.16 | | Daily Target 3 | 59.913333333333 | | Daily Target 4 | 61.05 | | Daily Target 5 | 61.8 |
Daily price and volume H B
| Date |
Closing |
Open |
Range |
Volume |
Tue 21 October 2025 |
60.29 (2.03%) |
58.96 |
58.78 - 60.67 |
1.482 times |
Mon 20 October 2025 |
59.09 (0.48%) |
58.90 |
58.90 - 59.52 |
0.7678 times |
Fri 17 October 2025 |
58.81 (0.22%) |
58.01 |
57.94 - 58.90 |
1.0151 times |
Thu 16 October 2025 |
58.68 (-0.9%) |
59.26 |
57.89 - 59.30 |
0.8964 times |
Wed 15 October 2025 |
59.21 (0.41%) |
59.20 |
58.97 - 60.10 |
1.0569 times |
Tue 14 October 2025 |
58.97 (1.71%) |
57.24 |
57.24 - 59.24 |
0.8152 times |
Mon 13 October 2025 |
57.98 (-1.01%) |
57.51 |
57.36 - 58.08 |
0.8283 times |
Tue 07 October 2025 |
58.57 (-0.73%) |
58.78 |
57.82 - 59.52 |
1.3614 times |
Mon 06 October 2025 |
59.00 (-0.47%) |
59.26 |
58.75 - 59.97 |
0.6372 times |
Fri 03 October 2025 |
59.28 (0.27%) |
59.00 |
58.98 - 59.87 |
1.1398 times |
Thu 02 October 2025 |
59.12 (0.82%) |
58.48 |
58.28 - 59.20 |
0.6435 times |
Weekly price and charts HB Strong weekly Stock price targets for HB FUL are 59.54 and 61.43 | Weekly Target 1 | 58.02 | | Weekly Target 2 | 59.16 | | Weekly Target 3 | 59.913333333333 | | Weekly Target 4 | 61.05 | | Weekly Target 5 | 61.8 |
Weekly price and volumes for H B
| Date |
Closing |
Open |
Range |
Volume |
Tue 21 October 2025 |
60.29 (2.52%) |
58.90 |
58.78 - 60.67 |
0.426 times |
Fri 17 October 2025 |
58.81 (0.41%) |
57.51 |
57.24 - 60.10 |
0.8733 times |
Tue 07 October 2025 |
58.57 (-1.2%) |
59.26 |
57.82 - 59.97 |
0.3784 times |
Fri 03 October 2025 |
59.28 (1.96%) |
58.24 |
56.78 - 59.87 |
1.1723 times |
Fri 26 September 2025 |
58.14 (-4.39%) |
60.77 |
56.97 - 61.36 |
1.6594 times |
Fri 19 September 2025 |
60.81 (-1.36%) |
61.98 |
60.49 - 63.36 |
1.8459 times |
Fri 12 September 2025 |
61.65 (-1.15%) |
62.12 |
60.66 - 63.81 |
1.6352 times |
Fri 05 September 2025 |
62.37 (2.16%) |
60.10 |
58.56 - 62.99 |
0.9651 times |
Fri 29 August 2025 |
61.05 (0%) |
61.29 |
60.68 - 61.39 |
0.1781 times |
Fri 29 August 2025 |
61.05 (-1.86%) |
61.82 |
60.56 - 62.64 |
0.8663 times |
Fri 22 August 2025 |
62.21 (5.49%) |
59.02 |
58.61 - 62.64 |
0.673 times |

Monthly price and charts HB Strong monthly Stock price targets for HB FUL are 58.77 and 62.2 | Monthly Target 1 | 55.97 | | Monthly Target 2 | 58.13 | | Monthly Target 3 | 59.4 | | Monthly Target 4 | 61.56 | | Monthly Target 5 | 62.83 |
Monthly price and volumes H B
| Date |
Closing |
Open |
Range |
Volume |
Tue 21 October 2025 |
60.29 (1.7%) |
58.87 |
57.24 - 60.67 |
0.4044 times |
Tue 30 September 2025 |
59.28 (-2.9%) |
60.10 |
56.78 - 63.81 |
1.1862 times |
Fri 29 August 2025 |
61.05 (8.63%) |
55.39 |
54.58 - 62.64 |
0.7579 times |
Thu 31 July 2025 |
56.20 (-6.57%) |
59.81 |
55.72 - 64.90 |
1.1684 times |
Mon 30 June 2025 |
60.15 (7.76%) |
55.54 |
53.59 - 62.94 |
1.0886 times |
Fri 30 May 2025 |
55.82 (3.29%) |
53.85 |
52.37 - 58.25 |
0.7018 times |
Wed 30 April 2025 |
54.04 (-3.71%) |
56.66 |
47.56 - 58.15 |
1.2609 times |
Mon 31 March 2025 |
56.12 (-1.09%) |
57.29 |
52.59 - 58.14 |
1.3043 times |
Fri 28 February 2025 |
56.74 (-10.12%) |
62.31 |
55.45 - 62.36 |
0.9957 times |
Fri 31 January 2025 |
63.13 (-6.45%) |
61.71 |
60.96 - 65.46 |
1.1317 times |
Tue 31 December 2024 |
67.48 (-11.81%) |
77.14 |
66.46 - 77.77 |
0.6056 times |

DMA SMA EMA moving averages of H B FUL
DMA (daily moving average) of H B FUL
| DMA period | DMA value | | 5 day DMA | 59.22 | | 12 day DMA | 58.97 | | 20 day DMA | 59.04 | | 35 day DMA | 60.08 | | 50 day DMA | 59.95 | | 100 day DMA | 59.12 | | 150 day DMA | 57.49 | | 200 day DMA | 58.25 | EMA (exponential moving average) of H B FUL
| EMA period | EMA current | EMA prev | EMA prev2 | | 5 day EMA | 59.36 | 58.9 | 58.81 | | 12 day EMA | 59.17 | 58.97 | 58.95 | | 20 day EMA | 59.3 | 59.2 | 59.21 | | 35 day EMA | 59.32 | 59.26 | 59.27 | | 50 day EMA | 59.56 | 59.53 | 59.55 |
SMA (simple moving average) of H B FUL
| SMA period | SMA current | SMA prev | SMA prev2 | | 5 day SMA | 59.22 | 58.95 | 58.73 | | 12 day SMA | 58.97 | 58.89 | 58.83 | | 20 day SMA | 59.04 | 59.11 | 59.19 | | 35 day SMA | 60.08 | 60.1 | 60.17 | | 50 day SMA | 59.95 | 59.87 | 59.81 | | 100 day SMA | 59.12 | 59.06 | 59.02 | | 150 day SMA | 57.49 | 57.44 | 57.42 | | 200 day SMA | 58.25 | 58.28 | 58.32 |
|
|
