FubotvInc FUBO full analysis,charts,indicators,moving averages,SMA,DMA,EMA,ADX,MACD,RSIFubotv Inc FUBO WideScreen charts, DMA,SMA,EMA technical analysis, forecast prediction, by indicators ADX,MACD,RSI,CCI NYSE stock exchange
Daily price and charts and targets FubotvInc Strong Daily Stock price targets for FubotvInc FUBO are 2.79 and 2.91 | Daily Target 1 | 2.76 | | Daily Target 2 | 2.81 | | Daily Target 3 | 2.8833333333333 | | Daily Target 4 | 2.93 | | Daily Target 5 | 3 |
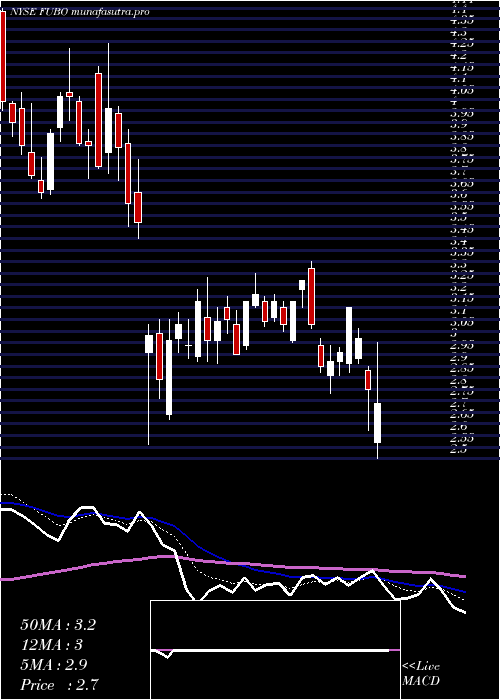
Daily price and volume Fubotv Inc
| Date |
Closing |
Open |
Range |
Volume |
Fri 05 December 2025 |
2.85 (-1.72%) |
2.95 |
2.84 - 2.96 |
0.7895 times |
Thu 04 December 2025 |
2.90 (1.4%) |
2.85 |
2.81 - 2.90 |
0.8409 times |
Wed 03 December 2025 |
2.86 (-1.04%) |
2.89 |
2.85 - 2.93 |
0.8224 times |
Tue 02 December 2025 |
2.89 (-0.34%) |
2.90 |
2.83 - 2.96 |
0.9542 times |
Mon 01 December 2025 |
2.90 (-4.61%) |
2.97 |
2.90 - 2.98 |
1.0122 times |
Fri 28 November 2025 |
3.04 (0.66%) |
3.03 |
2.95 - 3.08 |
0.85 times |
Wed 26 November 2025 |
3.02 (-3.21%) |
3.13 |
3.01 - 3.16 |
1.034 times |
Tue 25 November 2025 |
3.12 (0.65%) |
3.10 |
3.04 - 3.16 |
0.7947 times |
Mon 24 November 2025 |
3.10 (-1.9%) |
3.25 |
3.07 - 3.25 |
1.19 times |
Fri 21 November 2025 |
3.16 (-2.47%) |
3.25 |
3.05 - 3.27 |
1.7122 times |
Thu 20 November 2025 |
3.24 (-4.99%) |
3.51 |
3.22 - 3.52 |
1.4249 times |
Weekly price and charts FubotvInc Strong weekly Stock price targets for FubotvInc FUBO are 2.75 and 2.92 | Weekly Target 1 | 2.71 | | Weekly Target 2 | 2.78 | | Weekly Target 3 | 2.88 | | Weekly Target 4 | 2.95 | | Weekly Target 5 | 3.05 |
Weekly price and volumes for Fubotv Inc
| Date |
Closing |
Open |
Range |
Volume |
Fri 05 December 2025 |
2.85 (-6.25%) |
2.97 |
2.81 - 2.98 |
0.6877 times |
Fri 28 November 2025 |
3.04 (-3.8%) |
3.25 |
2.95 - 3.25 |
0.602 times |
Fri 21 November 2025 |
3.16 (-12.47%) |
3.60 |
3.05 - 3.64 |
1.0912 times |
Fri 14 November 2025 |
3.61 (-6.96%) |
3.93 |
3.55 - 4.02 |
0.8897 times |
Fri 07 November 2025 |
3.88 (2.65%) |
3.35 |
3.21 - 4.20 |
1.4599 times |
Fri 31 October 2025 |
3.78 (0%) |
3.66 |
3.61 - 3.80 |
0.4178 times |
Fri 31 October 2025 |
3.78 (4.42%) |
3.67 |
3.49 - 4.39 |
2.3783 times |
Fri 24 October 2025 |
3.62 (-0.82%) |
3.68 |
3.36 - 3.78 |
0.677 times |
Fri 17 October 2025 |
3.65 (-0.82%) |
3.72 |
3.50 - 3.97 |
0.938 times |
Fri 10 October 2025 |
3.68 (-7.77%) |
4.00 |
3.64 - 4.05 |
0.8584 times |
Fri 03 October 2025 |
3.99 (-5%) |
4.20 |
3.75 - 4.29 |
0.9483 times |

Monthly price and charts FubotvInc Strong monthly Stock price targets for FubotvInc FUBO are 2.75 and 2.92 | Monthly Target 1 | 2.71 | | Monthly Target 2 | 2.78 | | Monthly Target 3 | 2.88 | | Monthly Target 4 | 2.95 | | Monthly Target 5 | 3.05 |
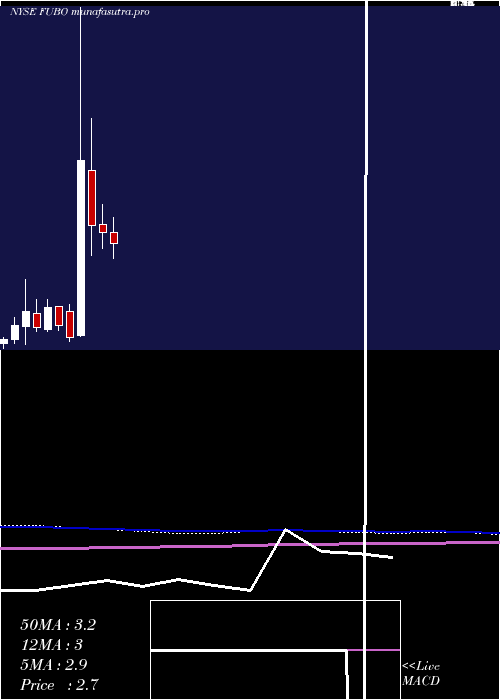
Monthly price and volumes Fubotv Inc
| Date |
Closing |
Open |
Range |
Volume |
Fri 05 December 2025 |
2.85 (-6.25%) |
2.97 |
2.81 - 2.98 |
0.1532 times |
Fri 28 November 2025 |
3.04 (-19.58%) |
3.35 |
2.95 - 4.20 |
0.9008 times |
Fri 31 October 2025 |
3.78 (-8.92%) |
4.12 |
3.36 - 4.39 |
1.3179 times |
Tue 30 September 2025 |
4.15 (17.56%) |
3.50 |
3.44 - 4.72 |
0.975 times |
Fri 29 August 2025 |
3.53 (-11.31%) |
3.87 |
3.25 - 4.09 |
1.059 times |
Thu 31 July 2025 |
3.98 (3.11%) |
3.85 |
3.28 - 4.40 |
1.2389 times |
Mon 30 June 2025 |
3.86 (5.46%) |
3.67 |
2.97 - 3.93 |
0.7249 times |
Fri 30 May 2025 |
3.66 (22%) |
3.08 |
2.28 - 3.91 |
1.5872 times |
Wed 30 April 2025 |
3.00 (2.74%) |
2.92 |
2.50 - 3.25 |
0.9322 times |
Mon 31 March 2025 |
2.92 (-3.63%) |
3.04 |
2.67 - 3.35 |
1.111 times |
Fri 28 February 2025 |
3.03 (-25%) |
3.88 |
2.56 - 4.71 |
1.6361 times |
DMA SMA EMA moving averages of Fubotv Inc FUBO
DMA (daily moving average) of Fubotv Inc FUBO
| DMA period | DMA value | | 5 day DMA | 2.88 | | 12 day DMA | 3.04 | | 20 day DMA | 3.32 | | 35 day DMA | 3.48 | | 50 day DMA | 3.61 | | 100 day DMA | 3.7 | | 150 day DMA | 3.57 | | 200 day DMA | 3.45 | EMA (exponential moving average) of Fubotv Inc FUBO
| EMA period | EMA current | EMA prev | EMA prev2 | | 5 day EMA | 2.9 | 2.93 | 2.95 | | 12 day EMA | 3.06 | 3.1 | 3.14 | | 20 day EMA | 3.21 | 3.25 | 3.29 | | 35 day EMA | 3.41 | 3.44 | 3.47 | | 50 day EMA | 3.6 | 3.63 | 3.66 |
SMA (simple moving average) of Fubotv Inc FUBO
| SMA period | SMA current | SMA prev | SMA prev2 | | 5 day SMA | 2.88 | 2.92 | 2.94 | | 12 day SMA | 3.04 | 3.1 | 3.14 | | 20 day SMA | 3.32 | 3.36 | 3.42 | | 35 day SMA | 3.48 | 3.5 | 3.53 | | 50 day SMA | 3.61 | 3.63 | 3.66 | | 100 day SMA | 3.7 | 3.71 | 3.72 | | 150 day SMA | 3.57 | 3.57 | 3.57 | | 200 day SMA | 3.45 | 3.45 | 3.46 |
|
|
