FlotekIndustries FTK full analysis,charts,indicators,moving averages,SMA,DMA,EMA,ADX,MACD,RSIFlotek Industries FTK WideScreen charts, DMA,SMA,EMA technical analysis, forecast prediction, by indicators ADX,MACD,RSI,CCI NYSE stock exchange
operates under Basic Industries sector & deals in Major Chemicals
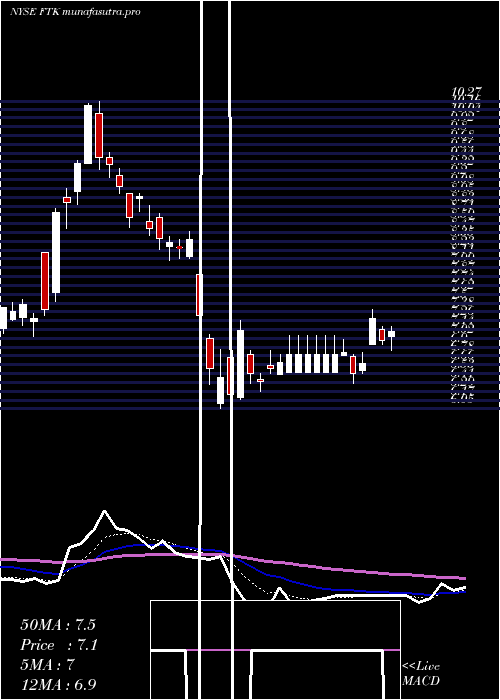
Daily price and charts and targets FlotekIndustries Strong Daily Stock price targets for FlotekIndustries FTK are 15.68 and 17.46 | Daily Target 1 | 14.34 | | Daily Target 2 | 15.24 | | Daily Target 3 | 16.116666666667 | | Daily Target 4 | 17.02 | | Daily Target 5 | 17.9 |
Daily price and volume Flotek Industries
| Date |
Closing |
Open |
Range |
Volume |
Tue 21 October 2025 |
16.15 (4.46%) |
15.50 |
15.21 - 16.99 |
2.3493 times |
Mon 20 October 2025 |
15.46 (5.82%) |
14.83 |
14.65 - 15.53 |
0.679 times |
Fri 17 October 2025 |
14.61 (-3.56%) |
15.15 |
14.57 - 15.15 |
0.7237 times |
Thu 16 October 2025 |
15.15 (-3.56%) |
15.84 |
14.95 - 16.14 |
0.6211 times |
Wed 15 October 2025 |
15.71 (-1.01%) |
16.15 |
15.18 - 16.20 |
0.7475 times |
Tue 14 October 2025 |
15.87 (-0.25%) |
15.50 |
15.05 - 16.24 |
0.9919 times |
Mon 13 October 2025 |
15.91 (4.67%) |
15.48 |
15.01 - 16.14 |
1.2689 times |
Fri 10 October 2025 |
15.20 (-2.5%) |
15.66 |
15.17 - 16.37 |
0.8701 times |
Thu 09 October 2025 |
15.59 (-4.59%) |
16.48 |
15.31 - 16.48 |
1.0477 times |
Wed 08 October 2025 |
16.34 (2.57%) |
16.03 |
15.76 - 16.50 |
0.7008 times |
Tue 07 October 2025 |
15.93 (-9.85%) |
17.71 |
15.90 - 17.81 |
1.456 times |
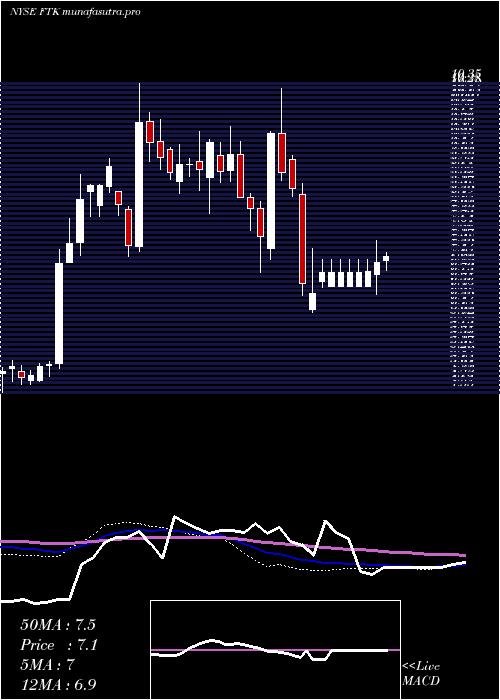
Weekly price and charts FlotekIndustries Strong weekly Stock price targets for FlotekIndustries FTK are 15.4 and 17.74 | Weekly Target 1 | 13.59 | | Weekly Target 2 | 14.87 | | Weekly Target 3 | 15.93 | | Weekly Target 4 | 17.21 | | Weekly Target 5 | 18.27 |
Weekly price and volumes for Flotek Industries
| Date |
Closing |
Open |
Range |
Volume |
Tue 21 October 2025 |
16.15 (10.54%) |
14.83 |
14.65 - 16.99 |
0.6086 times |
Fri 17 October 2025 |
14.61 (-3.88%) |
15.48 |
14.57 - 16.24 |
0.8748 times |
Fri 10 October 2025 |
15.20 (-4.52%) |
16.10 |
15.17 - 17.99 |
1.2323 times |
Fri 03 October 2025 |
15.92 (8.67%) |
14.87 |
14.02 - 16.22 |
1.3563 times |
Fri 26 September 2025 |
14.65 (12.52%) |
12.92 |
12.60 - 15.18 |
1.3035 times |
Fri 19 September 2025 |
13.02 (14.01%) |
11.44 |
11.42 - 13.14 |
1.8234 times |
Fri 12 September 2025 |
11.42 (1.42%) |
11.48 |
10.95 - 11.69 |
1.177 times |
Fri 05 September 2025 |
11.26 (-6.87%) |
11.83 |
11.20 - 12.37 |
0.7928 times |
Fri 29 August 2025 |
12.09 (0%) |
12.27 |
12.00 - 12.27 |
0.124 times |
Fri 29 August 2025 |
12.09 (1.43%) |
11.95 |
11.95 - 12.84 |
0.7072 times |
Fri 22 August 2025 |
11.92 (-0.08%) |
11.75 |
10.96 - 12.32 |
1.0302 times |
Monthly price and charts FlotekIndustries Strong monthly Stock price targets for FlotekIndustries FTK are 15.23 and 18.91 | Monthly Target 1 | 12.47 | | Monthly Target 2 | 14.31 | | Monthly Target 3 | 16.15 | | Monthly Target 4 | 17.99 | | Monthly Target 5 | 19.83 |
Monthly price and volumes Flotek Industries
| Date |
Closing |
Open |
Range |
Volume |
Tue 21 October 2025 |
16.15 (10.62%) |
14.37 |
14.31 - 17.99 |
0.7785 times |
Tue 30 September 2025 |
14.60 (20.76%) |
11.83 |
10.95 - 15.18 |
1.3085 times |
Fri 29 August 2025 |
12.09 (0.33%) |
11.82 |
10.96 - 14.42 |
1.2247 times |
Thu 31 July 2025 |
12.05 (-18.36%) |
14.65 |
11.78 - 15.12 |
1.2265 times |
Mon 30 June 2025 |
14.76 (0.61%) |
15.00 |
13.43 - 16.87 |
1.8302 times |
Fri 30 May 2025 |
14.67 (110.78%) |
7.00 |
7.00 - 15.96 |
1.387 times |
Wed 30 April 2025 |
6.96 (-16.45%) |
8.27 |
6.05 - 8.48 |
0.4771 times |
Mon 31 March 2025 |
8.33 (4%) |
8.01 |
6.80 - 10.27 |
0.6927 times |
Fri 28 February 2025 |
8.01 (-13.41%) |
9.00 |
7.59 - 9.55 |
0.4052 times |
Fri 31 January 2025 |
9.25 (-2.94%) |
9.57 |
7.92 - 9.80 |
0.6695 times |
Tue 31 December 2024 |
9.53 (12.91%) |
8.43 |
7.11 - 10.35 |
0.6074 times |

DMA SMA EMA moving averages of Flotek Industries FTK
DMA (daily moving average) of Flotek Industries FTK
| DMA period | DMA value | | 5 day DMA | 15.42 | | 12 day DMA | 15.8 | | 20 day DMA | 15.37 | | 35 day DMA | 13.89 | | 50 day DMA | 13.32 | | 100 day DMA | 13.59 | | 150 day DMA | 12.15 | | 200 day DMA | 11.26 | EMA (exponential moving average) of Flotek Industries FTK
| EMA period | EMA current | EMA prev | EMA prev2 | | 5 day EMA | 15.59 | 15.31 | 15.24 | | 12 day EMA | 15.45 | 15.32 | 15.3 | | 20 day EMA | 15.08 | 14.97 | 14.92 | | 35 day EMA | 14.42 | 14.32 | 14.25 | | 50 day EMA | 13.53 | 13.42 | 13.34 |
SMA (simple moving average) of Flotek Industries FTK
| SMA period | SMA current | SMA prev | SMA prev2 | | 5 day SMA | 15.42 | 15.36 | 15.45 | | 12 day SMA | 15.8 | 15.78 | 15.76 | | 20 day SMA | 15.37 | 15.23 | 15.11 | | 35 day SMA | 13.89 | 13.77 | 13.68 | | 50 day SMA | 13.32 | 13.28 | 13.25 | | 100 day SMA | 13.59 | 13.57 | 13.56 | | 150 day SMA | 12.15 | 12.11 | 12.07 | | 200 day SMA | 11.26 | 11.23 | 11.2 |
|
|
