TechnipfmcPlc FTI full analysis,charts,indicators,moving averages,SMA,DMA,EMA,ADX,MACD,RSITechnipfmc Plc FTI WideScreen charts, DMA,SMA,EMA technical analysis, forecast prediction, by indicators ADX,MACD,RSI,CCI NYSE stock exchange
operates under Energy sector & deals in Metal Fabrications
Daily price and charts and targets TechnipfmcPlc Strong Daily Stock price targets for TechnipfmcPlc FTI are 46.41 and 47.44 | Daily Target 1 | 45.68 | | Daily Target 2 | 46.1 | | Daily Target 3 | 46.713333333333 | | Daily Target 4 | 47.13 | | Daily Target 5 | 47.74 |
Daily price and volume Technipfmc Plc
| Date |
Closing |
Open |
Range |
Volume |
Thu 04 December 2025 |
46.51 (-0.34%) |
46.37 |
46.30 - 47.33 |
0.8981 times |
Wed 03 December 2025 |
46.67 (2.98%) |
45.63 |
45.49 - 46.70 |
0.9332 times |
Tue 02 December 2025 |
45.32 (-0.7%) |
45.46 |
44.93 - 45.74 |
1.3879 times |
Mon 01 December 2025 |
45.64 (0.84%) |
45.32 |
45.00 - 46.23 |
1.169 times |
Fri 28 November 2025 |
45.26 (0.04%) |
44.58 |
44.57 - 45.48 |
0.5745 times |
Wed 26 November 2025 |
45.24 (0.47%) |
45.17 |
45.04 - 45.77 |
0.7856 times |
Tue 25 November 2025 |
45.03 (1.05%) |
44.49 |
44.22 - 45.09 |
1.2558 times |
Mon 24 November 2025 |
44.56 (0.95%) |
43.70 |
43.53 - 44.78 |
0.9618 times |
Fri 21 November 2025 |
44.14 (1.49%) |
43.23 |
43.15 - 44.44 |
0.9472 times |
Thu 20 November 2025 |
43.49 (-1.07%) |
44.10 |
43.28 - 45.01 |
1.0868 times |
Wed 19 November 2025 |
43.96 (0.43%) |
42.90 |
42.90 - 44.12 |
1.0381 times |
Weekly price and charts TechnipfmcPlc Strong weekly Stock price targets for TechnipfmcPlc FTI are 45.72 and 48.12 | Weekly Target 1 | 43.86 | | Weekly Target 2 | 45.18 | | Weekly Target 3 | 46.256666666667 | | Weekly Target 4 | 47.58 | | Weekly Target 5 | 48.66 |
Weekly price and volumes for Technipfmc Plc
| Date |
Closing |
Open |
Range |
Volume |
Thu 04 December 2025 |
46.51 (2.76%) |
45.32 |
44.93 - 47.33 |
0.7487 times |
Fri 28 November 2025 |
45.26 (2.54%) |
43.70 |
43.53 - 45.77 |
0.6104 times |
Fri 21 November 2025 |
44.14 (1.03%) |
43.65 |
42.46 - 45.01 |
0.9364 times |
Fri 14 November 2025 |
43.69 (1.96%) |
43.21 |
42.61 - 44.34 |
1.0822 times |
Fri 07 November 2025 |
42.85 (3.63%) |
41.19 |
41.06 - 43.09 |
0.7916 times |
Fri 31 October 2025 |
41.35 (0%) |
41.91 |
41.21 - 41.98 |
0.1754 times |
Fri 31 October 2025 |
41.35 (4.71%) |
40.05 |
40.00 - 42.65 |
1.2047 times |
Fri 24 October 2025 |
39.49 (9.94%) |
36.12 |
35.97 - 41.35 |
1.7831 times |
Fri 17 October 2025 |
35.92 (0.36%) |
36.33 |
35.29 - 36.80 |
1.5269 times |
Fri 10 October 2025 |
35.79 (-5.91%) |
38.50 |
35.58 - 38.89 |
1.1406 times |
Fri 03 October 2025 |
38.04 (-5.77%) |
40.32 |
37.99 - 40.34 |
1.2879 times |
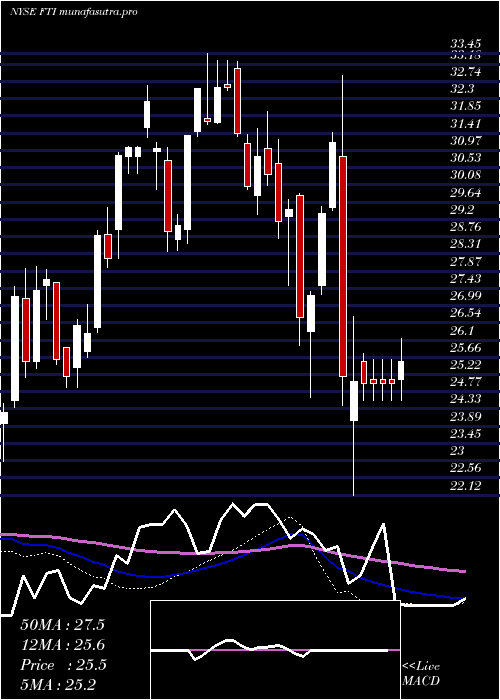
Monthly price and charts TechnipfmcPlc Strong monthly Stock price targets for TechnipfmcPlc FTI are 45.72 and 48.12 | Monthly Target 1 | 43.86 | | Monthly Target 2 | 45.18 | | Monthly Target 3 | 46.256666666667 | | Monthly Target 4 | 47.58 | | Monthly Target 5 | 48.66 |
Monthly price and volumes Technipfmc Plc
| Date |
Closing |
Open |
Range |
Volume |
Thu 04 December 2025 |
46.51 (2.76%) |
45.32 |
44.93 - 47.33 |
0.1247 times |
Fri 28 November 2025 |
45.26 (9.46%) |
41.19 |
41.06 - 45.77 |
0.5699 times |
Fri 31 October 2025 |
41.35 (4.82%) |
39.12 |
35.29 - 42.65 |
1.0698 times |
Tue 30 September 2025 |
39.45 (7.32%) |
36.44 |
36.15 - 41.30 |
2.0557 times |
Fri 29 August 2025 |
36.76 (1.07%) |
35.91 |
34.27 - 37.17 |
0.6486 times |
Thu 31 July 2025 |
36.37 (5.6%) |
34.59 |
31.88 - 38.05 |
1.1568 times |
Mon 30 June 2025 |
34.44 (10.56%) |
31.66 |
30.86 - 35.71 |
0.9691 times |
Fri 30 May 2025 |
31.15 (10.58%) |
28.03 |
28.00 - 31.76 |
0.8676 times |
Wed 30 April 2025 |
28.17 (-11.11%) |
31.55 |
22.12 - 32.90 |
1.2546 times |
Mon 31 March 2025 |
31.69 (7.64%) |
29.81 |
24.62 - 31.75 |
1.2831 times |
Fri 28 February 2025 |
29.44 (-2.03%) |
29.80 |
27.51 - 31.95 |
0.8324 times |

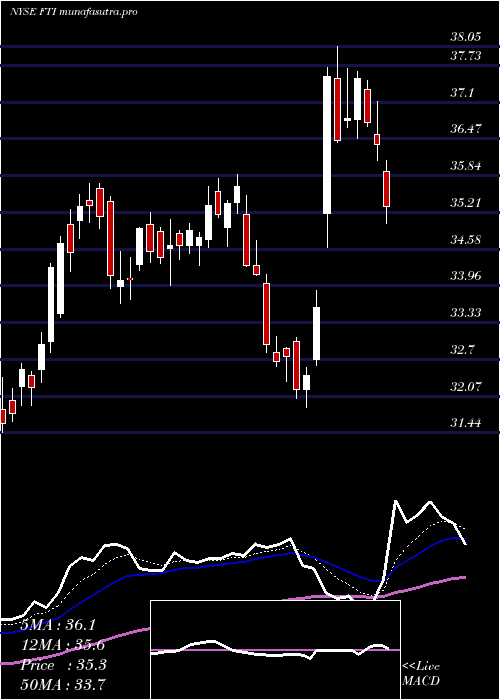
DMA SMA EMA moving averages of Technipfmc Plc FTI
DMA (daily moving average) of Technipfmc Plc FTI
| DMA period | DMA value | | 5 day DMA | 45.88 | | 12 day DMA | 44.97 | | 20 day DMA | 44.23 | | 35 day DMA | 42.24 | | 50 day DMA | 40.98 | | 100 day DMA | 38.83 | | 150 day DMA | 36.72 | | 200 day DMA | 34.39 | EMA (exponential moving average) of Technipfmc Plc FTI
| EMA period | EMA current | EMA prev | EMA prev2 | | 5 day EMA | 45.96 | 45.68 | 45.18 | | 12 day EMA | 45.08 | 44.82 | 44.48 | | 20 day EMA | 44.2 | 43.96 | 43.68 | | 35 day EMA | 42.8 | 42.58 | 42.34 | | 50 day EMA | 41.33 | 41.12 | 40.89 |
SMA (simple moving average) of Technipfmc Plc FTI
| SMA period | SMA current | SMA prev | SMA prev2 | | 5 day SMA | 45.88 | 45.63 | 45.3 | | 12 day SMA | 44.97 | 44.65 | 44.4 | | 20 day SMA | 44.23 | 44.02 | 43.78 | | 35 day SMA | 42.24 | 41.93 | 41.62 | | 50 day SMA | 40.98 | 40.84 | 40.7 | | 100 day SMA | 38.83 | 38.71 | 38.58 | | 150 day SMA | 36.72 | 36.6 | 36.48 | | 200 day SMA | 34.39 | 34.31 | 34.23 |
|
|
