FederalSignal FSS full analysis,charts,indicators,moving averages,SMA,DMA,EMA,ADX,MACD,RSIFederal Signal FSS WideScreen charts, DMA,SMA,EMA technical analysis, forecast prediction, by indicators ADX,MACD,RSI,CCI NYSE stock exchange
operates under Capital Goods sector & deals in Auto Manufacturing
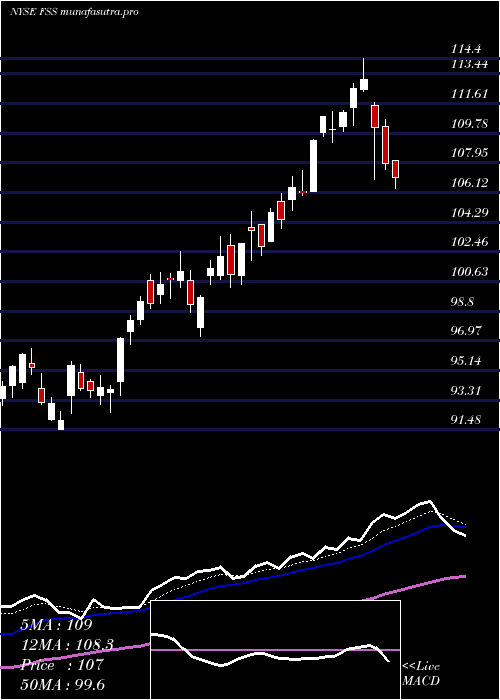
Daily price and charts and targets FederalSignal Strong Daily Stock price targets for FederalSignal FSS are 121.96 and 123.86 | Daily Target 1 | 120.48 | | Daily Target 2 | 121.53 | | Daily Target 3 | 122.37666666667 | | Daily Target 4 | 123.43 | | Daily Target 5 | 124.28 |
Daily price and volume Federal Signal
| Date |
Closing |
Open |
Range |
Volume |
Mon 20 October 2025 |
122.59 (1.75%) |
121.32 |
121.32 - 123.22 |
0.7046 times |
Fri 17 October 2025 |
120.48 (0.64%) |
119.11 |
118.76 - 120.91 |
1.4849 times |
Thu 16 October 2025 |
119.71 (0.5%) |
119.90 |
118.57 - 120.60 |
0.7857 times |
Wed 15 October 2025 |
119.12 (0.26%) |
119.11 |
117.98 - 120.77 |
1.3037 times |
Tue 14 October 2025 |
118.81 (1.93%) |
115.74 |
115.36 - 119.66 |
0.7177 times |
Mon 13 October 2025 |
116.56 (0.53%) |
117.15 |
115.61 - 118.00 |
1.2037 times |
Fri 10 October 2025 |
115.94 (-1.6%) |
117.91 |
115.80 - 118.70 |
1.2642 times |
Thu 09 October 2025 |
117.83 (-2.57%) |
120.81 |
117.81 - 120.81 |
0.8443 times |
Wed 08 October 2025 |
120.94 (2.29%) |
118.61 |
118.21 - 121.16 |
0.836 times |
Tue 07 October 2025 |
118.23 (-0.11%) |
118.35 |
117.98 - 119.28 |
0.8552 times |
Mon 06 October 2025 |
118.36 (-0.09%) |
118.59 |
118.00 - 120.47 |
0.5026 times |
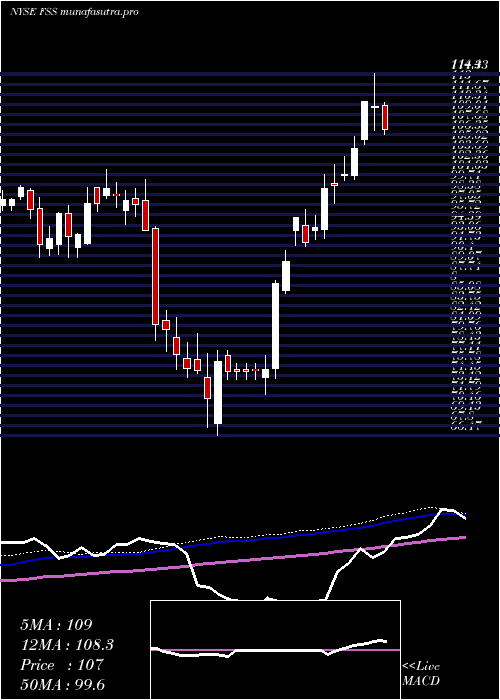
Weekly price and charts FederalSignal Strong weekly Stock price targets for FederalSignal FSS are 121.96 and 123.86 | Weekly Target 1 | 120.48 | | Weekly Target 2 | 121.53 | | Weekly Target 3 | 122.37666666667 | | Weekly Target 4 | 123.43 | | Weekly Target 5 | 124.28 |
Weekly price and volumes for Federal Signal
| Date |
Closing |
Open |
Range |
Volume |
Mon 20 October 2025 |
122.59 (1.75%) |
121.32 |
121.32 - 123.22 |
0.1575 times |
Fri 17 October 2025 |
120.48 (3.92%) |
117.15 |
115.36 - 120.91 |
1.2281 times |
Fri 10 October 2025 |
115.94 (-2.14%) |
118.59 |
115.80 - 121.16 |
0.9614 times |
Fri 03 October 2025 |
118.47 (-3.08%) |
122.75 |
115.97 - 123.18 |
1.5111 times |
Fri 26 September 2025 |
122.24 (-2.43%) |
124.85 |
120.73 - 128.70 |
1.3745 times |
Fri 19 September 2025 |
125.29 (-0.25%) |
126.17 |
124.20 - 128.19 |
1.8893 times |
Fri 12 September 2025 |
125.60 (0.54%) |
125.09 |
121.86 - 128.37 |
0.8421 times |
Fri 05 September 2025 |
124.93 (1.58%) |
121.12 |
120.68 - 126.11 |
0.6742 times |
Fri 29 August 2025 |
122.99 (0%) |
126.57 |
122.55 - 126.73 |
0.2436 times |
Fri 29 August 2025 |
122.99 (-4.15%) |
128.35 |
122.55 - 128.68 |
1.1182 times |
Fri 22 August 2025 |
128.32 (3.12%) |
124.78 |
123.65 - 129.13 |
1.0083 times |
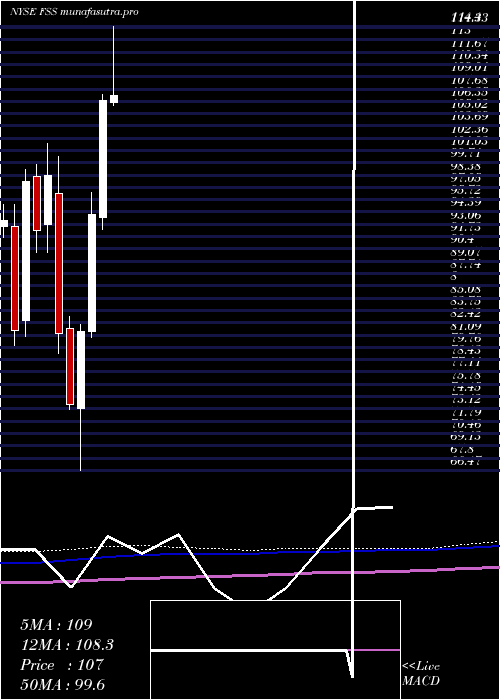
Monthly price and charts FederalSignal Strong monthly Stock price targets for FederalSignal FSS are 118.98 and 126.84 | Monthly Target 1 | 112.53 | | Monthly Target 2 | 117.56 | | Monthly Target 3 | 120.39 | | Monthly Target 4 | 125.42 | | Monthly Target 5 | 128.25 |
Monthly price and volumes Federal Signal
| Date |
Closing |
Open |
Range |
Volume |
Mon 20 October 2025 |
122.59 (3.03%) |
118.10 |
115.36 - 123.22 |
0.4925 times |
Tue 30 September 2025 |
118.99 (-3.25%) |
121.12 |
117.78 - 128.70 |
0.8412 times |
Fri 29 August 2025 |
122.99 (-2.83%) |
124.17 |
120.96 - 130.30 |
1.0342 times |
Thu 31 July 2025 |
126.57 (18.93%) |
106.20 |
104.39 - 128.50 |
1.6578 times |
Mon 30 June 2025 |
106.42 (13.13%) |
93.78 |
92.55 - 107.09 |
0.9101 times |
Fri 30 May 2025 |
94.07 (15.52%) |
81.50 |
80.79 - 96.48 |
0.8708 times |
Wed 30 April 2025 |
81.43 (10.71%) |
73.14 |
66.47 - 82.20 |
1.2776 times |
Mon 31 March 2025 |
73.55 (-9.51%) |
81.81 |
73.05 - 83.12 |
1.2237 times |
Fri 28 February 2025 |
81.28 (-17.32%) |
96.36 |
79.07 - 100.36 |
0.8869 times |
Fri 31 January 2025 |
98.31 (6.41%) |
93.07 |
90.06 - 101.77 |
0.8053 times |
Tue 31 December 2024 |
92.39 (-5.45%) |
98.20 |
90.02 - 99.57 |
0.4541 times |
DMA SMA EMA moving averages of Federal Signal FSS
DMA (daily moving average) of Federal Signal FSS
| DMA period | DMA value | | 5 day DMA | 120.14 | | 12 day DMA | 118.92 | | 20 day DMA | 119.59 | | 35 day DMA | 122 | | 50 day DMA | 123.35 | | 100 day DMA | 115.44 | | 150 day DMA | 104.04 | | 200 day DMA | 101.08 | EMA (exponential moving average) of Federal Signal FSS
| EMA period | EMA current | EMA prev | EMA prev2 | | 5 day EMA | 120.43 | 119.35 | 118.78 | | 12 day EMA | 119.77 | 119.26 | 119.04 | | 20 day EMA | 120.28 | 120.04 | 119.99 | | 35 day EMA | 121.48 | 121.41 | 121.46 | | 50 day EMA | 123.24 | 123.27 | 123.38 |
SMA (simple moving average) of Federal Signal FSS
| SMA period | SMA current | SMA prev | SMA prev2 | | 5 day SMA | 120.14 | 118.94 | 118.03 | | 12 day SMA | 118.92 | 118.52 | 118.32 | | 20 day SMA | 119.59 | 119.78 | 120.02 | | 35 day SMA | 122 | 122.01 | 122.08 | | 50 day SMA | 123.35 | 123.42 | 123.52 | | 100 day SMA | 115.44 | 115.17 | 114.89 | | 150 day SMA | 104.04 | 103.73 | 103.43 | | 200 day SMA | 101.08 | 100.93 | 100.79 |
|
|
