FastlyInc FSLY full analysis,charts,indicators,moving averages,SMA,DMA,EMA,ADX,MACD,RSIFastly Inc FSLY WideScreen charts, DMA,SMA,EMA technical analysis, forecast prediction, by indicators ADX,MACD,RSI,CCI NYSE stock exchange
Daily price and charts and targets FastlyInc Strong Daily Stock price targets for FastlyInc FSLY are 9.57 and 11.16 | Daily Target 1 | 9.25 | | Daily Target 2 | 9.88 | | Daily Target 3 | 10.836666666667 | | Daily Target 4 | 11.47 | | Daily Target 5 | 12.43 |
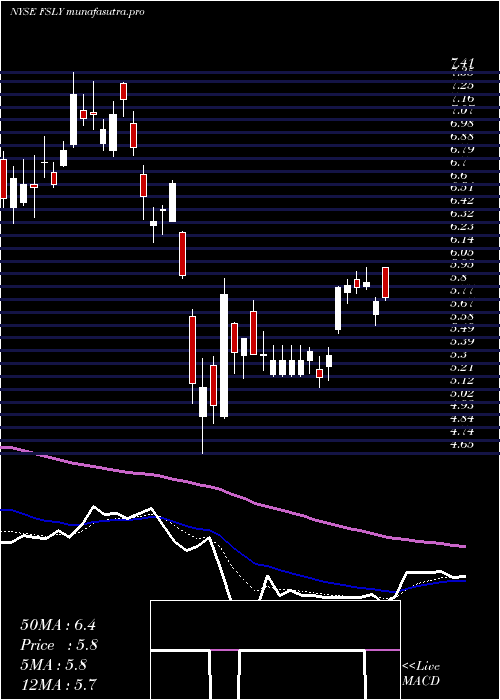
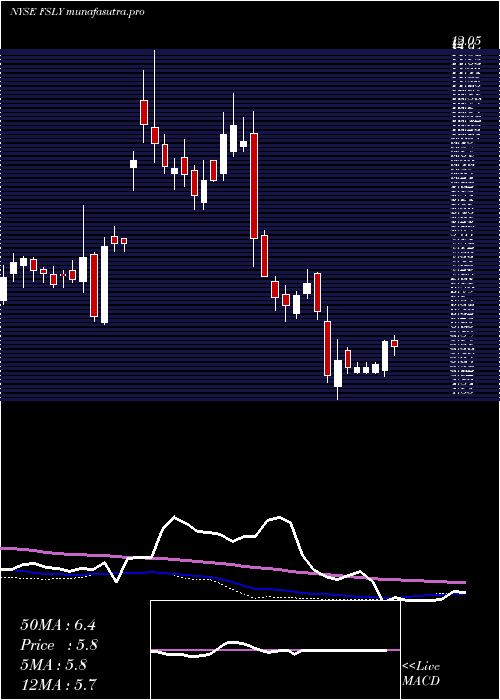
Daily price and volume Fastly Inc
| Date |
Closing |
Open |
Range |
Volume |
Fri 05 December 2025 |
10.52 (-8.68%) |
11.57 |
10.20 - 11.79 |
2.7281 times |
Thu 04 December 2025 |
11.52 (-1.87%) |
11.29 |
11.03 - 11.60 |
1.3816 times |
Wed 03 December 2025 |
11.74 (0.69%) |
11.74 |
11.32 - 11.74 |
0.713 times |
Tue 02 December 2025 |
11.66 (-0.85%) |
11.82 |
11.46 - 12.59 |
0.6028 times |
Mon 01 December 2025 |
11.76 (0.86%) |
11.45 |
11.20 - 11.78 |
0.6707 times |
Fri 28 November 2025 |
11.66 (-1.85%) |
11.82 |
11.53 - 11.85 |
0.3435 times |
Wed 26 November 2025 |
11.88 (-3.73%) |
12.32 |
11.41 - 12.60 |
0.7602 times |
Tue 25 November 2025 |
12.34 (6.1%) |
11.54 |
11.36 - 12.42 |
1.0285 times |
Mon 24 November 2025 |
11.63 (6.6%) |
11.02 |
10.93 - 11.63 |
0.6537 times |
Fri 21 November 2025 |
10.91 (3.51%) |
10.52 |
10.23 - 11.15 |
1.1178 times |
Thu 20 November 2025 |
10.54 (-3.3%) |
11.06 |
10.48 - 11.44 |
0.9011 times |
Weekly price and charts FastlyInc Strong weekly Stock price targets for FastlyInc FSLY are 9.17 and 11.56 | Weekly Target 1 | 8.71 | | Weekly Target 2 | 9.62 | | Weekly Target 3 | 11.103333333333 | | Weekly Target 4 | 12.01 | | Weekly Target 5 | 13.49 |
Weekly price and volumes for Fastly Inc
| Date |
Closing |
Open |
Range |
Volume |
Fri 05 December 2025 |
10.52 (-9.78%) |
11.45 |
10.20 - 12.59 |
1.6099 times |
Fri 28 November 2025 |
11.66 (6.87%) |
11.02 |
10.93 - 12.60 |
0.7357 times |
Fri 21 November 2025 |
10.91 (-2.85%) |
11.49 |
10.07 - 11.51 |
1.3079 times |
Fri 14 November 2025 |
11.23 (-2.77%) |
11.75 |
10.90 - 12.54 |
1.3998 times |
Fri 07 November 2025 |
11.55 (39.32%) |
8.21 |
7.95 - 11.66 |
2.0397 times |
Fri 31 October 2025 |
8.29 (0%) |
8.09 |
8.03 - 8.36 |
0.1248 times |
Fri 31 October 2025 |
8.29 (-0.48%) |
8.45 |
7.90 - 8.48 |
0.5439 times |
Fri 24 October 2025 |
8.33 (4.39%) |
7.99 |
7.93 - 8.45 |
0.5588 times |
Fri 17 October 2025 |
7.98 (-3.04%) |
8.36 |
7.60 - 8.58 |
0.7108 times |
Fri 10 October 2025 |
8.23 (-6.58%) |
8.92 |
7.98 - 9.14 |
0.9687 times |
Fri 03 October 2025 |
8.81 (3.65%) |
8.57 |
8.28 - 9.18 |
1.0914 times |
Monthly price and charts FastlyInc Strong monthly Stock price targets for FastlyInc FSLY are 9.17 and 11.56 | Monthly Target 1 | 8.71 | | Monthly Target 2 | 9.62 | | Monthly Target 3 | 11.103333333333 | | Monthly Target 4 | 12.01 | | Monthly Target 5 | 13.49 |
Monthly price and volumes Fastly Inc
| Date |
Closing |
Open |
Range |
Volume |
Fri 05 December 2025 |
10.52 (-9.78%) |
11.45 |
10.20 - 12.59 |
0.4481 times |
Fri 28 November 2025 |
11.66 (40.65%) |
8.21 |
7.95 - 12.60 |
1.5262 times |
Fri 31 October 2025 |
8.29 (-3.04%) |
8.35 |
7.60 - 9.18 |
0.9907 times |
Tue 30 September 2025 |
8.55 (12.35%) |
7.45 |
7.06 - 9.10 |
1.3091 times |
Fri 29 August 2025 |
7.61 (12.08%) |
6.61 |
6.29 - 7.78 |
1.0822 times |
Thu 31 July 2025 |
6.79 (-3.82%) |
6.98 |
6.61 - 7.43 |
0.7348 times |
Mon 30 June 2025 |
7.06 (-3.02%) |
7.30 |
6.52 - 8.36 |
1.0823 times |
Fri 30 May 2025 |
7.28 (26.61%) |
6.00 |
5.63 - 8.35 |
0.9971 times |
Wed 30 April 2025 |
5.75 (-9.16%) |
6.41 |
4.65 - 6.63 |
0.7839 times |
Mon 31 March 2025 |
6.33 (-7.05%) |
6.87 |
6.18 - 7.41 |
1.0458 times |
Fri 28 February 2025 |
6.81 (-34.96%) |
10.01 |
6.54 - 10.76 |
1.2848 times |

DMA SMA EMA moving averages of Fastly Inc FSLY
DMA (daily moving average) of Fastly Inc FSLY
| DMA period | DMA value | | 5 day DMA | 11.44 | | 12 day DMA | 11.42 | | 20 day DMA | 11.4 | | 35 day DMA | 10.09 | | 50 day DMA | 9.61 | | 100 day DMA | 8.53 | | 150 day DMA | 8.1 | | 200 day DMA | 7.63 | EMA (exponential moving average) of Fastly Inc FSLY
| EMA period | EMA current | EMA prev | EMA prev2 | | 5 day EMA | 11.26 | 11.63 | 11.69 | | 12 day EMA | 11.3 | 11.44 | 11.42 | | 20 day EMA | 11.02 | 11.07 | 11.02 | | 35 day EMA | 10.45 | 10.45 | 10.39 | | 50 day EMA | 9.71 | 9.68 | 9.6 |
SMA (simple moving average) of Fastly Inc FSLY
| SMA period | SMA current | SMA prev | SMA prev2 | | 5 day SMA | 11.44 | 11.67 | 11.74 | | 12 day SMA | 11.42 | 11.42 | 11.33 | | 20 day SMA | 11.4 | 11.42 | 11.25 | | 35 day SMA | 10.09 | 10.02 | 9.93 | | 50 day SMA | 9.61 | 9.56 | 9.5 | | 100 day SMA | 8.53 | 8.49 | 8.45 | | 150 day SMA | 8.1 | 8.07 | 8.03 | | 200 day SMA | 7.63 | 7.62 | 7.6 |
|
|
