FederalRealty FRT-C full analysis,charts,indicators,moving averages,SMA,DMA,EMA,ADX,MACD,RSIFederal Realty FRT-C WideScreen charts, DMA,SMA,EMA technical analysis, forecast prediction, by indicators ADX,MACD,RSI,CCI NYSE stock exchange
Daily price and charts and targets FederalRealty Strong Daily Stock price targets for FederalRealty FRT-C are 20.11 and 20.2 | Daily Target 1 | 20.08 | | Daily Target 2 | 20.13 | | Daily Target 3 | 20.166666666667 | | Daily Target 4 | 20.22 | | Daily Target 5 | 20.26 |
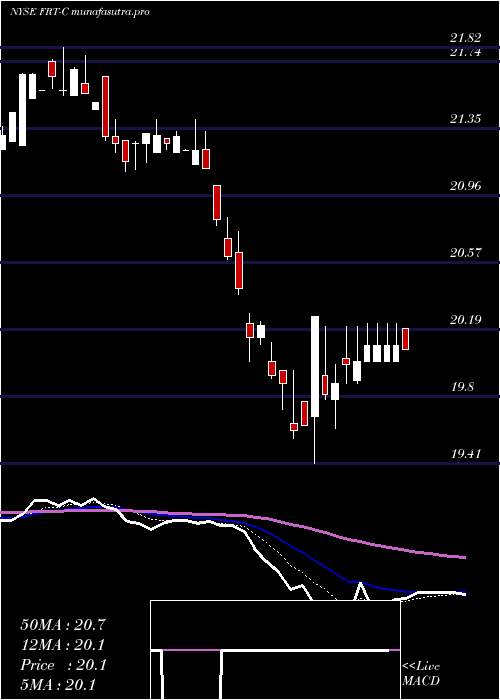
Daily price and volume Federal Realty
| Date |
Closing |
Open |
Range |
Volume |
Fri 05 December 2025 |
20.19 (0.2%) |
20.20 |
20.11 - 20.20 |
0.994 times |
Thu 04 December 2025 |
20.15 (-0.05%) |
20.07 |
20.01 - 20.37 |
1.1596 times |
Wed 03 December 2025 |
20.16 (0.2%) |
20.07 |
20.06 - 20.16 |
1.491 times |
Tue 02 December 2025 |
20.12 (-0.35%) |
20.14 |
20.08 - 20.16 |
1.2651 times |
Mon 01 December 2025 |
20.19 (-0.3%) |
20.16 |
20.09 - 20.21 |
0.5422 times |
Fri 28 November 2025 |
20.25 (0.15%) |
20.08 |
20.08 - 20.25 |
0.5723 times |
Wed 26 November 2025 |
20.22 (0.6%) |
20.05 |
20.05 - 20.26 |
0.8886 times |
Tue 25 November 2025 |
20.10 (0.55%) |
19.92 |
19.90 - 20.16 |
1.4608 times |
Mon 24 November 2025 |
19.99 (0.35%) |
19.91 |
19.91 - 19.99 |
0.3765 times |
Fri 21 November 2025 |
19.92 (0.91%) |
19.81 |
19.74 - 19.92 |
1.25 times |
Thu 20 November 2025 |
19.74 (-0.3%) |
19.85 |
19.68 - 19.98 |
1.5813 times |
Weekly price and charts FederalRealty Strong weekly Stock price targets for FederalRealty FRT-C are 20.1 and 20.46 | Weekly Target 1 | 19.83 | | Weekly Target 2 | 20.01 | | Weekly Target 3 | 20.19 | | Weekly Target 4 | 20.37 | | Weekly Target 5 | 20.55 |
Weekly price and volumes for Federal Realty
| Date |
Closing |
Open |
Range |
Volume |
Fri 05 December 2025 |
20.19 (-0.3%) |
20.16 |
20.01 - 20.37 |
1.3759 times |
Fri 28 November 2025 |
20.25 (1.66%) |
19.91 |
19.90 - 20.26 |
0.8324 times |
Fri 21 November 2025 |
19.92 (-2.06%) |
20.34 |
19.68 - 20.45 |
2.4173 times |
Fri 14 November 2025 |
20.34 (-2.07%) |
20.80 |
20.27 - 20.91 |
1.1859 times |
Fri 07 November 2025 |
20.77 (-0.72%) |
20.97 |
20.77 - 21.02 |
0.7982 times |
Fri 31 October 2025 |
20.92 (0%) |
20.81 |
20.81 - 20.99 |
0.1444 times |
Fri 31 October 2025 |
20.92 (0.1%) |
20.95 |
20.81 - 21.16 |
0.6385 times |
Fri 24 October 2025 |
20.90 (-0.95%) |
21.03 |
20.89 - 21.29 |
1.3835 times |
Fri 17 October 2025 |
21.10 (1.01%) |
20.78 |
20.78 - 21.21 |
0.5853 times |
Fri 10 October 2025 |
20.89 (-2.15%) |
21.25 |
20.89 - 21.37 |
0.6385 times |
Fri 03 October 2025 |
21.35 (-0.7%) |
21.50 |
21.07 - 21.51 |
1.8282 times |

Monthly price and charts FederalRealty Strong monthly Stock price targets for FederalRealty FRT-C are 20.1 and 20.46 | Monthly Target 1 | 19.83 | | Monthly Target 2 | 20.01 | | Monthly Target 3 | 20.19 | | Monthly Target 4 | 20.37 | | Monthly Target 5 | 20.55 |
Monthly price and volumes Federal Realty
| Date |
Closing |
Open |
Range |
Volume |
Fri 05 December 2025 |
20.19 (-0.3%) |
20.16 |
20.01 - 20.37 |
0.188 times |
Fri 28 November 2025 |
20.25 (-3.2%) |
20.97 |
19.68 - 21.02 |
0.715 times |
Fri 31 October 2025 |
20.92 (-2.24%) |
21.15 |
20.78 - 21.37 |
0.5052 times |
Tue 30 September 2025 |
21.40 (3.03%) |
20.73 |
20.65 - 21.88 |
4.0553 times |
Fri 29 August 2025 |
20.77 (3.33%) |
20.13 |
19.97 - 20.80 |
0.6812 times |
Thu 31 July 2025 |
20.10 (0.3%) |
19.85 |
19.85 - 20.75 |
0.949 times |
Mon 30 June 2025 |
20.04 (-1.91%) |
20.33 |
20.04 - 20.50 |
0.3801 times |
Fri 30 May 2025 |
20.43 (-0.34%) |
20.71 |
20.02 - 20.73 |
0.486 times |
Wed 30 April 2025 |
20.50 (0.39%) |
20.22 |
19.41 - 20.89 |
1.1368 times |
Mon 31 March 2025 |
20.42 (-5.68%) |
21.57 |
20.39 - 21.82 |
0.9033 times |
Fri 28 February 2025 |
21.65 (0.65%) |
21.47 |
21.15 - 21.75 |
0.446 times |

DMA SMA EMA moving averages of Federal Realty FRT-C
DMA (daily moving average) of Federal Realty FRT-C
| DMA period | DMA value | | 5 day DMA | 20.16 | | 12 day DMA | 20.07 | | 20 day DMA | 20.25 | | 35 day DMA | 20.56 | | 50 day DMA | 20.76 | | 100 day DMA | 20.75 | | 150 day DMA | 20.61 | | 200 day DMA | 20.65 | EMA (exponential moving average) of Federal Realty FRT-C
| EMA period | EMA current | EMA prev | EMA prev2 | | 5 day EMA | 20.16 | 20.15 | 20.15 | | 12 day EMA | 20.18 | 20.18 | 20.19 | | 20 day EMA | 20.28 | 20.29 | 20.3 | | 35 day EMA | 20.52 | 20.54 | 20.56 | | 50 day EMA | 20.79 | 20.81 | 20.84 |
SMA (simple moving average) of Federal Realty FRT-C
| SMA period | SMA current | SMA prev | SMA prev2 | | 5 day SMA | 20.16 | 20.17 | 20.19 | | 12 day SMA | 20.07 | 20.04 | 20.04 | | 20 day SMA | 20.25 | 20.28 | 20.31 | | 35 day SMA | 20.56 | 20.59 | 20.61 | | 50 day SMA | 20.76 | 20.79 | 20.83 | | 100 day SMA | 20.75 | 20.75 | 20.75 | | 150 day SMA | 20.61 | 20.61 | 20.62 | | 200 day SMA | 20.65 | 20.66 | 20.67 |
|
|
