FlowserveCorporation FLS full analysis,charts,indicators,moving averages,SMA,DMA,EMA,ADX,MACD,RSIFlowserve Corporation FLS WideScreen charts, DMA,SMA,EMA technical analysis, forecast prediction, by indicators ADX,MACD,RSI,CCI NYSE stock exchange
operates under Capital Goods sector & deals in Fluid Controls
Daily price and charts and targets FlowserveCorporation Strong Daily Stock price targets for FlowserveCorporation FLS are 71.81 and 73.06 | Daily Target 1 | 70.89 | | Daily Target 2 | 71.47 | | Daily Target 3 | 72.143333333333 | | Daily Target 4 | 72.72 | | Daily Target 5 | 73.39 |
Daily price and volume Flowserve Corporation
| Date |
Closing |
Open |
Range |
Volume |
Fri 05 December 2025 |
72.04 (0.21%) |
71.82 |
71.57 - 72.82 |
0.9838 times |
Thu 04 December 2025 |
71.89 (1.4%) |
71.00 |
70.63 - 72.68 |
1.2797 times |
Wed 03 December 2025 |
70.90 (1.34%) |
70.39 |
69.19 - 72.06 |
1.5087 times |
Tue 02 December 2025 |
69.96 (-1.28%) |
71.21 |
69.89 - 71.62 |
0.9377 times |
Mon 01 December 2025 |
70.87 (-0.67%) |
70.52 |
70.04 - 71.51 |
0.9154 times |
Fri 28 November 2025 |
71.35 (1.12%) |
70.99 |
70.51 - 71.74 |
0.3461 times |
Wed 26 November 2025 |
70.56 (0.37%) |
70.35 |
69.80 - 71.71 |
0.714 times |
Tue 25 November 2025 |
70.30 (2.22%) |
68.92 |
68.62 - 70.48 |
0.8886 times |
Mon 24 November 2025 |
68.77 (1.51%) |
67.83 |
67.51 - 69.10 |
1.3943 times |
Fri 21 November 2025 |
67.75 (2.56%) |
65.97 |
65.47 - 67.79 |
1.0316 times |
Thu 20 November 2025 |
66.06 (-1.9%) |
68.64 |
65.68 - 69.18 |
1.4535 times |
Weekly price and charts FlowserveCorporation Strong weekly Stock price targets for FlowserveCorporation FLS are 70.62 and 74.25 | Weekly Target 1 | 67.72 | | Weekly Target 2 | 69.88 | | Weekly Target 3 | 71.35 | | Weekly Target 4 | 73.51 | | Weekly Target 5 | 74.98 |
Weekly price and volumes for Flowserve Corporation
| Date |
Closing |
Open |
Range |
Volume |
Fri 05 December 2025 |
72.04 (0.97%) |
70.52 |
69.19 - 72.82 |
0.824 times |
Fri 28 November 2025 |
71.35 (5.31%) |
67.83 |
67.51 - 71.74 |
0.4897 times |
Fri 21 November 2025 |
67.75 (0.88%) |
67.13 |
64.77 - 69.18 |
1.0154 times |
Fri 14 November 2025 |
67.16 (-3%) |
70.60 |
64.69 - 71.24 |
0.8267 times |
Fri 07 November 2025 |
69.24 (1.45%) |
70.23 |
67.52 - 71.19 |
0.9281 times |
Fri 31 October 2025 |
68.25 (0%) |
67.62 |
67.08 - 68.56 |
0.3151 times |
Fri 31 October 2025 |
68.25 (27.81%) |
53.77 |
52.37 - 70.32 |
2.7813 times |
Fri 24 October 2025 |
53.40 (5.68%) |
50.83 |
50.64 - 53.51 |
0.7998 times |
Fri 17 October 2025 |
50.53 (2.93%) |
50.05 |
49.10 - 51.67 |
0.9653 times |
Fri 10 October 2025 |
49.09 (-6.97%) |
53.28 |
48.71 - 53.43 |
1.0546 times |
Fri 03 October 2025 |
52.77 (-2.37%) |
54.55 |
52.11 - 54.55 |
0.8409 times |
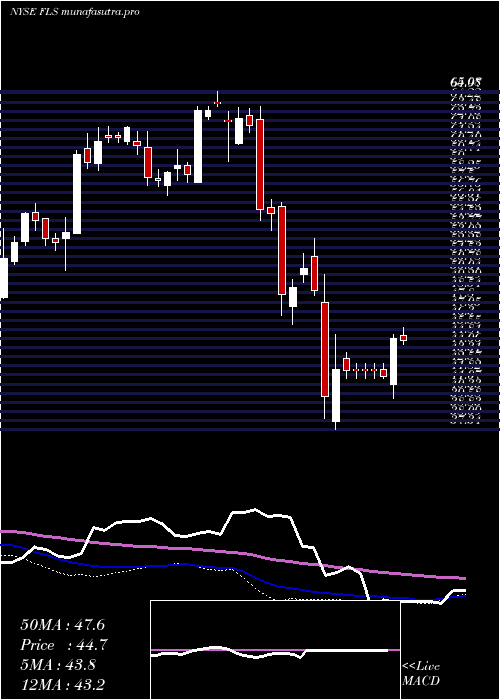
Monthly price and charts FlowserveCorporation Strong monthly Stock price targets for FlowserveCorporation FLS are 70.62 and 74.25 | Monthly Target 1 | 67.72 | | Monthly Target 2 | 69.88 | | Monthly Target 3 | 71.35 | | Monthly Target 4 | 73.51 | | Monthly Target 5 | 74.98 |
Monthly price and volumes Flowserve Corporation
| Date |
Closing |
Open |
Range |
Volume |
Fri 05 December 2025 |
72.04 (0.97%) |
70.52 |
69.19 - 72.82 |
0.1754 times |
Fri 28 November 2025 |
71.35 (4.54%) |
70.23 |
64.69 - 71.74 |
0.6939 times |
Fri 31 October 2025 |
68.25 (28.43%) |
52.74 |
48.71 - 70.32 |
1.361 times |
Tue 30 September 2025 |
53.14 (-0.97%) |
52.83 |
52.47 - 57.88 |
1.1203 times |
Fri 29 August 2025 |
53.66 (-4.25%) |
53.64 |
51.42 - 55.19 |
0.7305 times |
Thu 31 July 2025 |
56.04 (7.05%) |
51.74 |
51.42 - 59.25 |
1.7256 times |
Mon 30 June 2025 |
52.35 (4.89%) |
50.02 |
45.11 - 54.06 |
1.7163 times |
Fri 30 May 2025 |
49.91 (10.35%) |
45.79 |
45.05 - 52.50 |
0.6576 times |
Wed 30 April 2025 |
45.23 (-7.39%) |
48.54 |
37.34 - 50.03 |
0.9453 times |
Mon 31 March 2025 |
48.84 (-11.26%) |
55.68 |
45.99 - 55.96 |
0.874 times |
Fri 28 February 2025 |
55.04 (-12.1%) |
60.84 |
53.64 - 63.86 |
0.6416 times |

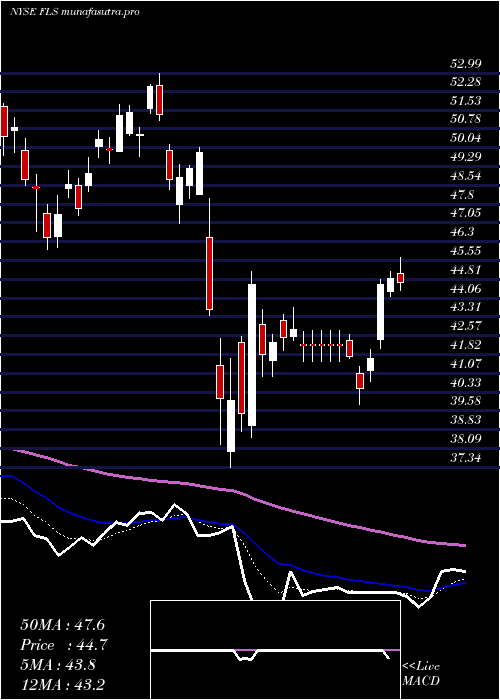
DMA SMA EMA moving averages of Flowserve Corporation FLS
DMA (daily moving average) of Flowserve Corporation FLS
| DMA period | DMA value | | 5 day DMA | 71.13 | | 12 day DMA | 69.82 | | 20 day DMA | 69.12 | | 35 day DMA | 65.18 | | 50 day DMA | 61.21 | | 100 day DMA | 57.86 | | 150 day DMA | 55.25 | | 200 day DMA | 53.22 | EMA (exponential moving average) of Flowserve Corporation FLS
| EMA period | EMA current | EMA prev | EMA prev2 | | 5 day EMA | 71.27 | 70.89 | 70.39 | | 12 day EMA | 70.08 | 69.72 | 69.33 | | 20 day EMA | 68.62 | 68.26 | 67.88 | | 35 day EMA | 65.18 | 64.78 | 64.36 | | 50 day EMA | 61.76 | 61.34 | 60.91 |
SMA (simple moving average) of Flowserve Corporation FLS
| SMA period | SMA current | SMA prev | SMA prev2 | | 5 day SMA | 71.13 | 70.99 | 70.73 | | 12 day SMA | 69.82 | 69.27 | 68.75 | | 20 day SMA | 69.12 | 69 | 68.9 | | 35 day SMA | 65.18 | 64.56 | 63.95 | | 50 day SMA | 61.21 | 60.84 | 60.51 | | 100 day SMA | 57.86 | 57.68 | 57.48 | | 150 day SMA | 55.25 | 55.08 | 54.9 | | 200 day SMA | 53.22 | 53.15 | 53.08 |
|
|
