FluorCorporation FLR full analysis,charts,indicators,moving averages,SMA,DMA,EMA,ADX,MACD,RSIFluor Corporation FLR WideScreen charts, DMA,SMA,EMA technical analysis, forecast prediction, by indicators ADX,MACD,RSI,CCI NYSE stock exchange
operates under Basic Industries sector & deals in Military Government Technical
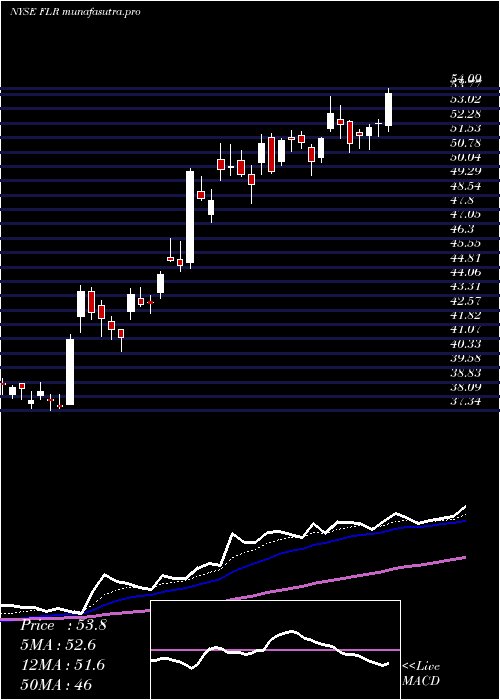
Daily price and charts and targets FluorCorporation Strong Daily Stock price targets for FluorCorporation FLR are 46.31 and 49.9 | Daily Target 1 | 45.48 | | Daily Target 2 | 47.13 | | Daily Target 3 | 49.066666666667 | | Daily Target 4 | 50.72 | | Daily Target 5 | 52.66 |
Daily price and volume Fluor Corporation
| Date |
Closing |
Open |
Range |
Volume |
Tue 21 October 2025 |
48.79 (1.88%) |
49.92 |
47.41 - 51.00 |
2.0763 times |
Mon 20 October 2025 |
47.89 (2.66%) |
47.00 |
47.00 - 48.18 |
0.3603 times |
Fri 17 October 2025 |
46.65 (-3.74%) |
47.68 |
46.57 - 48.52 |
0.7643 times |
Thu 16 October 2025 |
48.46 (-4.47%) |
51.77 |
47.59 - 51.95 |
1.0553 times |
Wed 15 October 2025 |
50.73 (5.18%) |
49.65 |
49.12 - 52.05 |
1.8171 times |
Tue 14 October 2025 |
48.23 (2.14%) |
45.96 |
45.81 - 49.00 |
1.0504 times |
Mon 13 October 2025 |
47.22 (10.02%) |
44.99 |
44.77 - 47.74 |
1.1902 times |
Tue 07 October 2025 |
42.92 (-2.3%) |
44.11 |
42.12 - 44.55 |
0.6014 times |
Mon 06 October 2025 |
43.93 (1.34%) |
43.20 |
43.20 - 44.62 |
0.5477 times |
Fri 03 October 2025 |
43.35 (-0.28%) |
43.06 |
42.53 - 43.82 |
0.537 times |
Thu 02 October 2025 |
43.47 (1.42%) |
42.99 |
40.56 - 43.80 |
0.498 times |
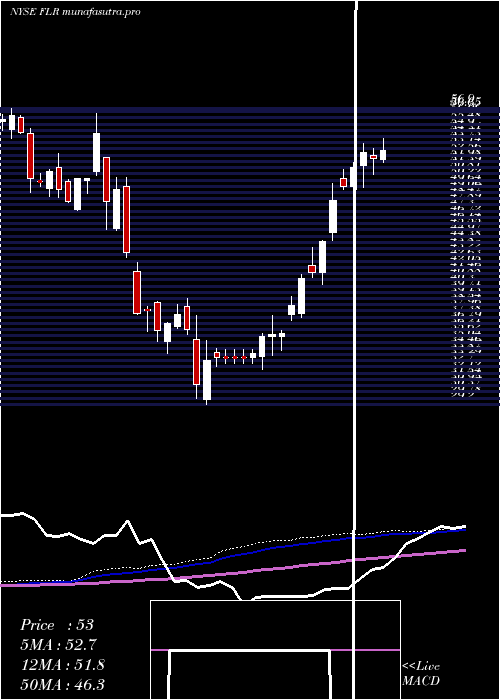
Weekly price and charts FluorCorporation Strong weekly Stock price targets for FluorCorporation FLR are 47.9 and 51.9 | Weekly Target 1 | 44.93 | | Weekly Target 2 | 46.86 | | Weekly Target 3 | 48.93 | | Weekly Target 4 | 50.86 | | Weekly Target 5 | 52.93 |
Weekly price and volumes for Fluor Corporation
| Date |
Closing |
Open |
Range |
Volume |
Tue 21 October 2025 |
48.79 (4.59%) |
47.00 |
47.00 - 51.00 |
0.7455 times |
Fri 17 October 2025 |
46.65 (8.69%) |
44.99 |
44.77 - 52.05 |
1.7983 times |
Tue 07 October 2025 |
42.92 (-0.99%) |
43.20 |
42.12 - 44.62 |
0.3516 times |
Fri 03 October 2025 |
43.35 (2.8%) |
42.50 |
40.56 - 43.82 |
0.97 times |
Fri 26 September 2025 |
42.17 (-5.45%) |
44.17 |
41.80 - 45.54 |
1.032 times |
Fri 19 September 2025 |
44.60 (8.75%) |
41.33 |
39.86 - 44.83 |
1.6079 times |
Fri 12 September 2025 |
41.01 (-1.35%) |
41.59 |
40.24 - 41.72 |
0.9318 times |
Fri 05 September 2025 |
41.57 (1.34%) |
40.25 |
39.66 - 43.94 |
1.2525 times |
Fri 29 August 2025 |
41.02 (0%) |
41.55 |
40.49 - 41.60 |
0.1649 times |
Fri 29 August 2025 |
41.02 (-1.28%) |
41.29 |
40.38 - 42.02 |
1.1455 times |
Fri 22 August 2025 |
41.55 (-0.79%) |
41.65 |
39.95 - 42.90 |
1.3973 times |
Monthly price and charts FluorCorporation Strong monthly Stock price targets for FluorCorporation FLR are 44.68 and 56.17 | Monthly Target 1 | 35.64 | | Monthly Target 2 | 42.22 | | Monthly Target 3 | 47.133333333333 | | Monthly Target 4 | 53.71 | | Monthly Target 5 | 58.62 |
Monthly price and volumes Fluor Corporation
| Date |
Closing |
Open |
Range |
Volume |
Tue 21 October 2025 |
48.79 (15.97%) |
41.84 |
40.56 - 52.05 |
0.7066 times |
Tue 30 September 2025 |
42.07 (2.56%) |
40.25 |
39.66 - 45.54 |
1.0825 times |
Fri 29 August 2025 |
41.02 (-27.74%) |
42.35 |
37.62 - 45.23 |
1.5412 times |
Thu 31 July 2025 |
56.77 (10.73%) |
51.00 |
49.57 - 57.50 |
0.9103 times |
Mon 30 June 2025 |
51.27 (23.3%) |
41.57 |
40.41 - 51.91 |
1.2546 times |
Fri 30 May 2025 |
41.58 (19.17%) |
35.80 |
34.28 - 43.86 |
1.0593 times |
Wed 30 April 2025 |
34.89 (-2.6%) |
35.68 |
29.20 - 37.49 |
0.7315 times |
Mon 31 March 2025 |
35.82 (-5.81%) |
38.72 |
34.01 - 39.14 |
0.8134 times |
Fri 28 February 2025 |
38.03 (-21.12%) |
45.73 |
36.00 - 50.47 |
1.0302 times |
Fri 31 January 2025 |
48.21 (-2.25%) |
49.74 |
45.58 - 56.50 |
0.8704 times |
Tue 31 December 2024 |
49.32 (-11.82%) |
54.96 |
48.72 - 56.90 |
0.3959 times |
DMA SMA EMA moving averages of Fluor Corporation FLR
DMA (daily moving average) of Fluor Corporation FLR
| DMA period | DMA value | | 5 day DMA | 48.5 | | 12 day DMA | 46.21 | | 20 day DMA | 45.05 | | 35 day DMA | 43.45 | | 50 day DMA | 42.92 | | 100 day DMA | 46.17 | | 150 day DMA | 42.64 | | 200 day DMA | 43.19 | EMA (exponential moving average) of Fluor Corporation FLR
| EMA period | EMA current | EMA prev | EMA prev2 | | 5 day EMA | 47.97 | 47.56 | 47.4 | | 12 day EMA | 46.63 | 46.24 | 45.94 | | 20 day EMA | 45.53 | 45.19 | 44.91 | | 35 day EMA | 44.52 | 44.27 | 44.06 | | 50 day EMA | 43.69 | 43.48 | 43.3 |
SMA (simple moving average) of Fluor Corporation FLR
| SMA period | SMA current | SMA prev | SMA prev2 | | 5 day SMA | 48.5 | 48.39 | 48.26 | | 12 day SMA | 46.21 | 45.65 | 45.21 | | 20 day SMA | 45.05 | 44.73 | 44.35 | | 35 day SMA | 43.45 | 43.25 | 43.05 | | 50 day SMA | 42.92 | 42.83 | 42.75 | | 100 day SMA | 46.17 | 46.05 | 45.95 | | 150 day SMA | 42.64 | 42.55 | 42.46 | | 200 day SMA | 43.19 | 43.19 | 43.2 |
|
|
