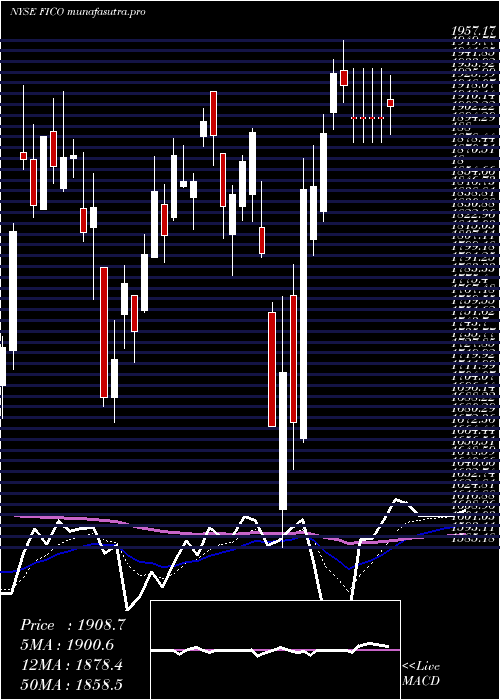
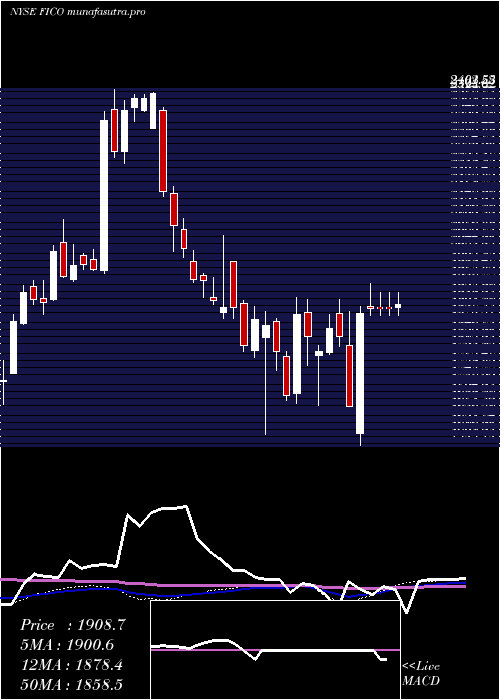
FairIsaac FICO full analysis,charts,indicators,moving averages,SMA,DMA,EMA,ADX,MACD,RSIFair Isaac FICO WideScreen charts, DMA,SMA,EMA technical analysis, forecast prediction, by indicators ADX,MACD,RSI,CCI NYSE stock exchange
operates under Miscellaneous sector & deals in Business Services
Daily price and charts and targets FairIsaac Strong Daily Stock price targets for FairIsaac FICO are 1600.96 and 1636.77 | Daily Target 1 | 1594.48 | | Daily Target 2 | 1607.44 | | Daily Target 3 | 1630.2933333333 | | Daily Target 4 | 1643.25 | | Daily Target 5 | 1666.1 |
Daily price and volume Fair Isaac
| Date |
Closing |
Open |
Range |
Volume |
Mon 20 October 2025 |
1620.39 (0.27%) |
1630.09 |
1617.34 - 1653.15 |
0.4696 times |
Fri 17 October 2025 |
1616.00 (-0.26%) |
1624.63 |
1604.33 - 1638.75 |
0.7491 times |
Thu 16 October 2025 |
1620.14 (-1.01%) |
1622.29 |
1607.50 - 1642.01 |
0.8399 times |
Wed 15 October 2025 |
1636.65 (-0.78%) |
1641.28 |
1611.94 - 1652.89 |
0.7981 times |
Tue 14 October 2025 |
1649.51 (-0.03%) |
1641.71 |
1581.48 - 1655.81 |
1.1789 times |
Mon 13 October 2025 |
1649.99 (-0.91%) |
1658.15 |
1648.31 - 1716.12 |
0.8425 times |
Fri 10 October 2025 |
1665.21 (-2.55%) |
1716.89 |
1652.14 - 1723.57 |
0.8694 times |
Thu 09 October 2025 |
1708.77 (0.81%) |
1693.40 |
1672.66 - 1730.23 |
0.9406 times |
Wed 08 October 2025 |
1695.01 (-9.82%) |
1821.39 |
1688.69 - 1835.93 |
2.2518 times |
Tue 07 October 2025 |
1879.55 (1.59%) |
1841.79 |
1825.00 - 1881.21 |
1.0601 times |
Mon 06 October 2025 |
1850.18 (-0.03%) |
1855.01 |
1829.12 - 1886.28 |
0.5958 times |
Weekly price and charts FairIsaac Strong weekly Stock price targets for FairIsaac FICO are 1600.96 and 1636.77 | Weekly Target 1 | 1594.48 | | Weekly Target 2 | 1607.44 | | Weekly Target 3 | 1630.2933333333 | | Weekly Target 4 | 1643.25 | | Weekly Target 5 | 1666.1 |
Weekly price and volumes for Fair Isaac
| Date |
Closing |
Open |
Range |
Volume |
Mon 20 October 2025 |
1620.39 (0.27%) |
1630.09 |
1617.34 - 1653.15 |
0.119 times |
Fri 17 October 2025 |
1616.00 (-2.96%) |
1658.15 |
1581.48 - 1716.12 |
1.117 times |
Fri 10 October 2025 |
1665.21 (-10.02%) |
1855.01 |
1652.14 - 1886.28 |
1.4487 times |
Fri 03 October 2025 |
1850.65 (21.85%) |
1521.05 |
1484.23 - 1998.01 |
1.5356 times |
Fri 26 September 2025 |
1518.78 (2.81%) |
1475.00 |
1460.91 - 1562.20 |
0.7182 times |
Fri 19 September 2025 |
1477.21 (-4.33%) |
1553.03 |
1464.80 - 1602.92 |
1.101 times |
Fri 12 September 2025 |
1544.05 (0.79%) |
1534.74 |
1511.04 - 1598.00 |
1.0943 times |
Fri 05 September 2025 |
1531.99 (0.68%) |
1505.00 |
1481.22 - 1559.37 |
0.9004 times |
Fri 29 August 2025 |
1521.64 (0%) |
1508.11 |
1490.63 - 1530.03 |
0.4815 times |
Fri 29 August 2025 |
1521.64 (7.47%) |
1416.32 |
1395.60 - 1530.03 |
1.4844 times |
Fri 22 August 2025 |
1415.90 (5.42%) |
1351.74 |
1331.51 - 1436.12 |
1.1483 times |
Monthly price and charts FairIsaac Strong monthly Stock price targets for FairIsaac FICO are 1552.31 and 2066.09 | Monthly Target 1 | 1187.1 | | Monthly Target 2 | 1403.74 | | Monthly Target 3 | 1700.8766666667 | | Monthly Target 4 | 1917.52 | | Monthly Target 5 | 2214.66 |
Monthly price and volumes Fair Isaac
| Date |
Closing |
Open |
Range |
Volume |
Mon 20 October 2025 |
1620.39 (8.28%) |
1506.31 |
1484.23 - 1998.01 |
0.9454 times |
Tue 30 September 2025 |
1496.53 (-1.65%) |
1505.00 |
1460.91 - 1602.92 |
0.9925 times |
Fri 29 August 2025 |
1521.64 (5.91%) |
1425.00 |
1300.00 - 1530.03 |
1.4445 times |
Thu 31 July 2025 |
1436.72 (-21.4%) |
1806.42 |
1354.48 - 1905.33 |
1.4934 times |
Mon 30 June 2025 |
1827.96 (5.89%) |
1708.71 |
1700.33 - 1940.60 |
0.8334 times |
Fri 30 May 2025 |
1726.28 (-13.24%) |
1999.63 |
1484.29 - 2217.60 |
1.3034 times |
Wed 30 April 2025 |
1989.68 (7.89%) |
1835.10 |
1585.18 - 2016.78 |
0.6927 times |
Mon 31 March 2025 |
1844.16 (-2.24%) |
1890.06 |
1676.86 - 1919.64 |
0.6536 times |
Fri 28 February 2025 |
1886.35 (0.68%) |
1832.42 |
1610.40 - 1924.32 |
0.7552 times |
Fri 31 January 2025 |
1873.56 (-5.9%) |
2005.00 |
1787.57 - 2066.68 |
0.8859 times |
Tue 31 December 2024 |
1990.93 (-16.43%) |
2313.30 |
1974.41 - 2396.68 |
0.4569 times |

DMA SMA EMA moving averages of Fair Isaac FICO
DMA (daily moving average) of Fair Isaac FICO
| DMA period | DMA value | | 5 day DMA | 1628.54 | | 12 day DMA | 1703.5 | | 20 day DMA | 1645.33 | | 35 day DMA | 1598.22 | | 50 day DMA | 1538.46 | | 100 day DMA | 1593.83 | | 150 day DMA | 1701.51 | | 200 day DMA | 1738.57 | EMA (exponential moving average) of Fair Isaac FICO
| EMA period | EMA current | EMA prev | EMA prev2 | | 5 day EMA | 1632.56 | 1638.65 | 1649.97 | | 12 day EMA | 1648.77 | 1653.93 | 1660.82 | | 20 day EMA | 1635.04 | 1636.58 | 1638.75 | | 35 day EMA | 1588.73 | 1586.87 | 1585.15 | | 50 day EMA | 1531.07 | 1527.43 | 1523.82 |
SMA (simple moving average) of Fair Isaac FICO
| SMA period | SMA current | SMA prev | SMA prev2 | | 5 day SMA | 1628.54 | 1634.46 | 1644.3 | | 12 day SMA | 1703.5 | 1717.2 | 1708.59 | | 20 day SMA | 1645.33 | 1641.25 | 1634.31 | | 35 day SMA | 1598.22 | 1595.4 | 1592.7 | | 50 day SMA | 1538.46 | 1532.27 | 1526.37 | | 100 day SMA | 1593.83 | 1592.66 | 1593.44 | | 150 day SMA | 1701.51 | 1702.71 | 1703.56 | | 200 day SMA | 1738.57 | 1740.45 | 1742.32 |
|
|
