FreeportMcmoran FCX full analysis,charts,indicators,moving averages,SMA,DMA,EMA,ADX,MACD,RSIFreeport Mcmoran FCX WideScreen charts, DMA,SMA,EMA technical analysis, forecast prediction, by indicators ADX,MACD,RSI,CCI NYSE stock exchange
operates under Basic Industries sector & deals in Precious Metals
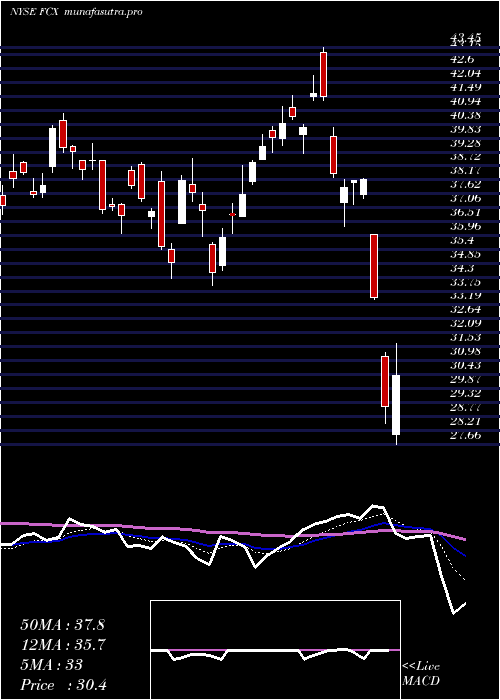
Daily price and charts and targets FreeportMcmoran Strong Daily Stock price targets for FreeportMcmoran FCX are 43.6 and 44.68 | Daily Target 1 | 43.26 | | Daily Target 2 | 43.93 | | Daily Target 3 | 44.336666666667 | | Daily Target 4 | 45.01 | | Daily Target 5 | 45.42 |
Daily price and volume Freeport Mcmoran
| Date |
Closing |
Open |
Range |
Volume |
Thu 04 December 2025 |
44.61 (0.18%) |
44.68 |
43.66 - 44.74 |
0.6498 times |
Wed 03 December 2025 |
44.53 (3.65%) |
44.33 |
44.13 - 45.09 |
1.9441 times |
Tue 02 December 2025 |
42.96 (-0.26%) |
43.35 |
42.31 - 43.55 |
0.5521 times |
Mon 01 December 2025 |
43.07 (0.21%) |
43.40 |
43.00 - 43.93 |
1.2424 times |
Fri 28 November 2025 |
42.98 (2.04%) |
42.76 |
42.32 - 43.41 |
0.7523 times |
Wed 26 November 2025 |
42.12 (2.61%) |
41.18 |
41.10 - 42.49 |
0.7073 times |
Tue 25 November 2025 |
41.05 (0.66%) |
41.00 |
40.75 - 41.79 |
0.5783 times |
Mon 24 November 2025 |
40.78 (2.28%) |
39.92 |
39.60 - 41.12 |
0.6364 times |
Fri 21 November 2025 |
39.87 (0.61%) |
39.83 |
38.85 - 40.30 |
1.6067 times |
Thu 20 November 2025 |
39.63 (-3.93%) |
41.90 |
39.31 - 41.90 |
1.3305 times |
Wed 19 November 2025 |
41.25 (3.13%) |
40.91 |
40.77 - 42.22 |
1.6898 times |
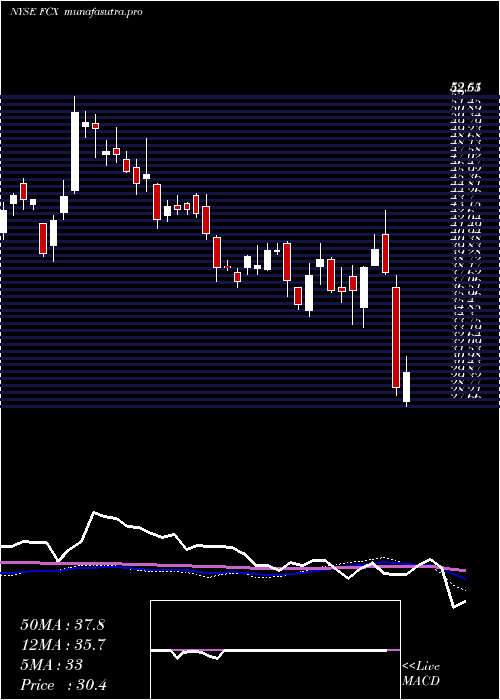
Weekly price and charts FreeportMcmoran Strong weekly Stock price targets for FreeportMcmoran FCX are 43.46 and 46.24 | Weekly Target 1 | 41.22 | | Weekly Target 2 | 42.92 | | Weekly Target 3 | 44.003333333333 | | Weekly Target 4 | 45.7 | | Weekly Target 5 | 46.78 |
Weekly price and volumes for Freeport Mcmoran
| Date |
Closing |
Open |
Range |
Volume |
Thu 04 December 2025 |
44.61 (3.79%) |
43.40 |
42.31 - 45.09 |
0.8719 times |
Fri 28 November 2025 |
42.98 (7.8%) |
39.92 |
39.60 - 43.41 |
0.5313 times |
Fri 21 November 2025 |
39.87 (-0.72%) |
39.99 |
38.34 - 42.22 |
1.5022 times |
Fri 14 November 2025 |
40.16 (0.88%) |
40.79 |
38.88 - 42.26 |
0.847 times |
Fri 07 November 2025 |
39.81 (-4.53%) |
40.40 |
38.54 - 40.89 |
0.8863 times |
Fri 31 October 2025 |
41.70 (0%) |
41.59 |
41.26 - 42.52 |
0.2017 times |
Fri 31 October 2025 |
41.70 (0.82%) |
41.73 |
40.45 - 43.49 |
1.1793 times |
Fri 24 October 2025 |
41.36 (0.22%) |
41.56 |
40.12 - 42.50 |
0.8176 times |
Fri 17 October 2025 |
41.27 (0.95%) |
43.29 |
40.50 - 43.50 |
1.2167 times |
Fri 10 October 2025 |
40.88 (2.66%) |
40.10 |
39.56 - 44.79 |
1.9459 times |
Fri 03 October 2025 |
39.82 (11.38%) |
36.35 |
36.05 - 40.35 |
2.3609 times |
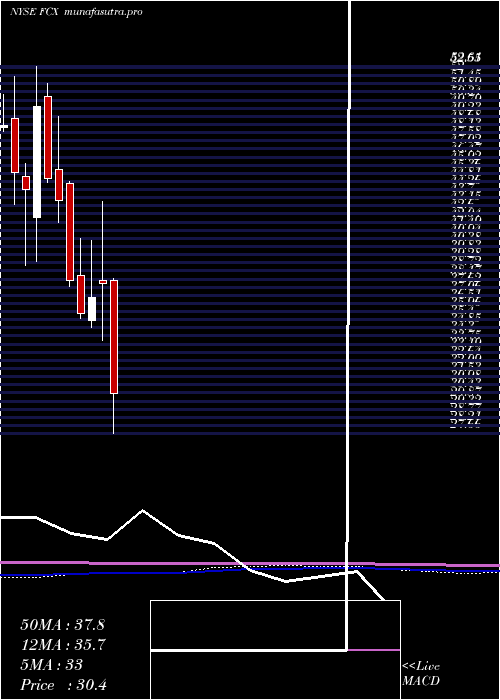
Monthly price and charts FreeportMcmoran Strong monthly Stock price targets for FreeportMcmoran FCX are 43.46 and 46.24 | Monthly Target 1 | 41.22 | | Monthly Target 2 | 42.92 | | Monthly Target 3 | 44.003333333333 | | Monthly Target 4 | 45.7 | | Monthly Target 5 | 46.78 |
Monthly price and volumes Freeport Mcmoran
| Date |
Closing |
Open |
Range |
Volume |
Thu 04 December 2025 |
44.61 (3.79%) |
43.40 |
42.31 - 45.09 |
0.1672 times |
Fri 28 November 2025 |
42.98 (3.07%) |
40.40 |
38.34 - 43.41 |
0.7225 times |
Fri 31 October 2025 |
41.70 (6.32%) |
39.03 |
38.19 - 44.79 |
1.2245 times |
Tue 30 September 2025 |
39.22 (-11.67%) |
43.76 |
35.15 - 47.02 |
1.6687 times |
Fri 29 August 2025 |
44.40 (10.34%) |
39.89 |
39.28 - 44.73 |
0.6914 times |
Thu 31 July 2025 |
40.24 (-7.17%) |
43.99 |
38.34 - 49.12 |
1.4439 times |
Mon 30 June 2025 |
43.35 (12.66%) |
40.09 |
39.51 - 44.90 |
0.7118 times |
Fri 30 May 2025 |
38.48 (6.8%) |
36.04 |
35.90 - 40.59 |
0.7593 times |
Wed 30 April 2025 |
36.03 (-4.83%) |
38.06 |
27.66 - 38.22 |
1.4504 times |
Mon 31 March 2025 |
37.86 (2.57%) |
38.10 |
33.98 - 43.45 |
1.1604 times |
Fri 28 February 2025 |
36.91 (2.96%) |
35.37 |
34.89 - 40.80 |
0.8954 times |
DMA SMA EMA moving averages of Freeport Mcmoran FCX
DMA (daily moving average) of Freeport Mcmoran FCX
| DMA period | DMA value | | 5 day DMA | 43.63 | | 12 day DMA | 41.9 | | 20 day DMA | 41.24 | | 35 day DMA | 41.25 | | 50 day DMA | 40.88 | | 100 day DMA | 42.21 | | 150 day DMA | 41.81 | | 200 day DMA | 40.35 | EMA (exponential moving average) of Freeport Mcmoran FCX
| EMA period | EMA current | EMA prev | EMA prev2 | | 5 day EMA | 43.62 | 43.13 | 42.43 | | 12 day EMA | 42.46 | 42.07 | 41.62 | | 20 day EMA | 41.9 | 41.61 | 41.3 | | 35 day EMA | 41.48 | 41.3 | 41.11 | | 50 day EMA | 41.38 | 41.25 | 41.12 |
SMA (simple moving average) of Freeport Mcmoran FCX
| SMA period | SMA current | SMA prev | SMA prev2 | | 5 day SMA | 43.63 | 43.13 | 42.44 | | 12 day SMA | 41.9 | 41.44 | 41.07 | | 20 day SMA | 41.24 | 41.02 | 40.77 | | 35 day SMA | 41.25 | 41.17 | 41.09 | | 50 day SMA | 40.88 | 40.74 | 40.76 | | 100 day SMA | 42.21 | 42.2 | 42.21 | | 150 day SMA | 41.81 | 41.75 | 41.7 | | 200 day SMA | 40.35 | 40.33 | 40.3 |
|
|
