EagleMaterials EXP full analysis,charts,indicators,moving averages,SMA,DMA,EMA,ADX,MACD,RSIEagle Materials EXP WideScreen charts, DMA,SMA,EMA technical analysis, forecast prediction, by indicators ADX,MACD,RSI,CCI NYSE stock exchange
operates under Capital Goods sector & deals in Building Materials
Daily price and charts and targets EagleMaterials Strong Daily Stock price targets for EagleMaterials EXP are 218.81 and 223.87 | Daily Target 1 | 217.78 | | Daily Target 2 | 219.83 | | Daily Target 3 | 222.83666666667 | | Daily Target 4 | 224.89 | | Daily Target 5 | 227.9 |
Daily price and volume Eagle Materials
| Date |
Closing |
Open |
Range |
Volume |
Thu 04 December 2025 |
221.89 (-0.95%) |
222.76 |
220.78 - 225.84 |
0.7767 times |
Wed 03 December 2025 |
224.01 (1.14%) |
222.22 |
221.81 - 227.21 |
1.078 times |
Tue 02 December 2025 |
221.48 (0.16%) |
221.95 |
219.30 - 222.91 |
0.9337 times |
Mon 01 December 2025 |
221.13 (-1.16%) |
220.91 |
220.00 - 226.34 |
0.8679 times |
Fri 28 November 2025 |
223.72 (1.14%) |
222.48 |
221.17 - 224.31 |
0.442 times |
Wed 26 November 2025 |
221.20 (0.78%) |
219.21 |
219.20 - 223.45 |
0.838 times |
Tue 25 November 2025 |
219.48 (3.95%) |
212.41 |
212.09 - 220.63 |
1.0988 times |
Mon 24 November 2025 |
211.15 (0.67%) |
208.84 |
207.99 - 211.93 |
1.3912 times |
Fri 21 November 2025 |
209.74 (3.57%) |
204.47 |
203.68 - 210.75 |
1.3733 times |
Thu 20 November 2025 |
202.52 (-0.59%) |
206.05 |
201.72 - 206.73 |
1.2005 times |
Wed 19 November 2025 |
203.72 (1.28%) |
202.65 |
200.78 - 205.73 |
0.7706 times |
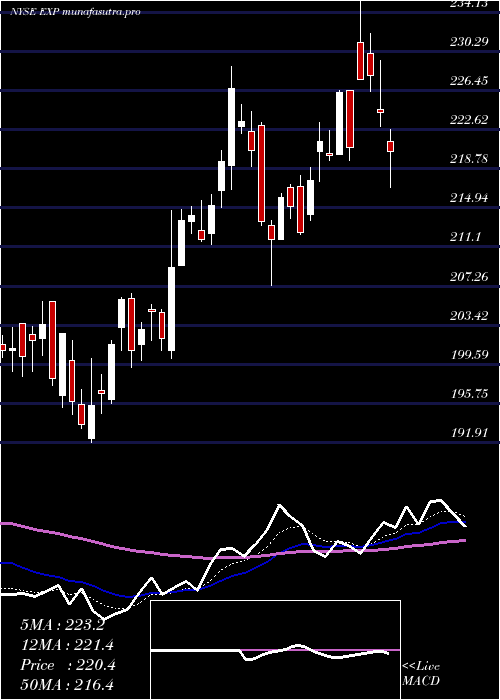
Weekly price and charts EagleMaterials Strong weekly Stock price targets for EagleMaterials EXP are 220.6 and 228.51 | Weekly Target 1 | 214.89 | | Weekly Target 2 | 218.39 | | Weekly Target 3 | 222.8 | | Weekly Target 4 | 226.3 | | Weekly Target 5 | 230.71 |
Weekly price and volumes for Eagle Materials
| Date |
Closing |
Open |
Range |
Volume |
Thu 04 December 2025 |
221.89 (-0.82%) |
220.91 |
219.30 - 227.21 |
0.8109 times |
Fri 28 November 2025 |
223.72 (6.67%) |
208.84 |
207.99 - 224.31 |
0.8361 times |
Fri 21 November 2025 |
209.74 (3.8%) |
201.82 |
197.93 - 210.75 |
1.3023 times |
Fri 14 November 2025 |
202.06 (-2.37%) |
208.29 |
200.01 - 210.10 |
1.3647 times |
Fri 07 November 2025 |
206.96 (-2.52%) |
206.33 |
203.00 - 210.81 |
1.0929 times |
Fri 31 October 2025 |
212.32 (0%) |
213.15 |
209.95 - 214.48 |
0.3334 times |
Fri 31 October 2025 |
212.32 (-8.93%) |
233.75 |
209.95 - 237.83 |
1.6684 times |
Fri 24 October 2025 |
233.14 (-1.73%) |
239.15 |
232.73 - 243.64 |
0.8144 times |
Fri 17 October 2025 |
237.24 (3.91%) |
230.26 |
227.57 - 243.58 |
1.0102 times |
Fri 10 October 2025 |
228.31 (-2.68%) |
235.52 |
228.06 - 239.13 |
0.7668 times |
Fri 03 October 2025 |
234.60 (1.01%) |
234.63 |
229.48 - 237.24 |
0.8843 times |

Monthly price and charts EagleMaterials Strong monthly Stock price targets for EagleMaterials EXP are 220.6 and 228.51 | Monthly Target 1 | 214.89 | | Monthly Target 2 | 218.39 | | Monthly Target 3 | 222.8 | | Monthly Target 4 | 226.3 | | Monthly Target 5 | 230.71 |
Monthly price and volumes Eagle Materials
| Date |
Closing |
Open |
Range |
Volume |
Thu 04 December 2025 |
221.89 (-0.82%) |
220.91 |
219.30 - 227.21 |
0.1837 times |
Fri 28 November 2025 |
223.72 (5.37%) |
206.33 |
197.93 - 224.31 |
1.0412 times |
Fri 31 October 2025 |
212.32 (-8.89%) |
232.64 |
209.95 - 243.64 |
1.1435 times |
Tue 30 September 2025 |
233.04 (0.93%) |
226.15 |
221.58 - 242.90 |
1.0357 times |
Fri 29 August 2025 |
230.90 (2.95%) |
221.44 |
216.90 - 241.56 |
0.861 times |
Thu 31 July 2025 |
224.29 (10.97%) |
200.96 |
200.14 - 238.50 |
1.2746 times |
Mon 30 June 2025 |
202.11 (-0.05%) |
200.48 |
191.91 - 206.51 |
1.0977 times |
Fri 30 May 2025 |
202.21 (-10.68%) |
227.55 |
199.66 - 243.00 |
1.1783 times |
Wed 30 April 2025 |
226.39 (2.01%) |
220.59 |
201.61 - 236.00 |
1.143 times |
Mon 31 March 2025 |
221.93 (-1.89%) |
228.69 |
205.44 - 232.08 |
1.0412 times |
Fri 28 February 2025 |
226.21 (-11.89%) |
252.12 |
220.60 - 262.81 |
0.908 times |

DMA SMA EMA moving averages of Eagle Materials EXP
DMA (daily moving average) of Eagle Materials EXP
| DMA period | DMA value | | 5 day DMA | 222.45 | | 12 day DMA | 215.1 | | 20 day DMA | 210.88 | | 35 day DMA | 217.85 | | 50 day DMA | 222.6 | | 100 day DMA | 225.52 | | 150 day DMA | 221.73 | | 200 day DMA | 221.2 | EMA (exponential moving average) of Eagle Materials EXP
| EMA period | EMA current | EMA prev | EMA prev2 | | 5 day EMA | 221.38 | 221.12 | 219.67 | | 12 day EMA | 217.46 | 216.65 | 215.31 | | 20 day EMA | 216.3 | 215.71 | 214.84 | | 35 day EMA | 218.68 | 218.49 | 218.17 | | 50 day EMA | 223.2 | 223.25 | 223.22 |
SMA (simple moving average) of Eagle Materials EXP
| SMA period | SMA current | SMA prev | SMA prev2 | | 5 day SMA | 222.45 | 222.31 | 221.4 | | 12 day SMA | 215.1 | 213.19 | 211.36 | | 20 day SMA | 210.88 | 210.14 | 209.36 | | 35 day SMA | 217.85 | 218.42 | 218.85 | | 50 day SMA | 222.6 | 222.69 | 222.79 | | 100 day SMA | 225.52 | 225.43 | 225.4 | | 150 day SMA | 221.73 | 221.76 | 221.75 | | 200 day SMA | 221.2 | 221.25 | 221.33 |
|
|
