EdwardsLifesciences EW full analysis,charts,indicators,moving averages,SMA,DMA,EMA,ADX,MACD,RSIEdwards Lifesciences EW WideScreen charts, DMA,SMA,EMA technical analysis, forecast prediction, by indicators ADX,MACD,RSI,CCI NYSE stock exchange
operates under Health Care sector & deals in Industrial Specialties
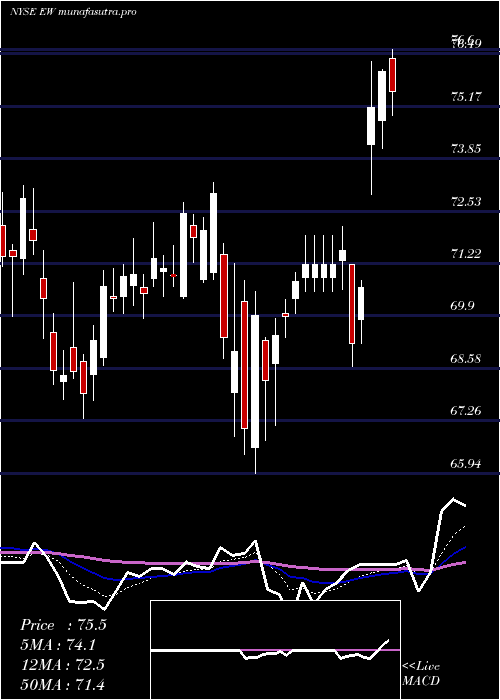
Daily price and charts and targets EdwardsLifesciences Strong Daily Stock price targets for EdwardsLifesciences EW are 75.36 and 76.77 | Daily Target 1 | 74.19 | | Daily Target 2 | 75.11 | | Daily Target 3 | 75.603333333333 | | Daily Target 4 | 76.52 | | Daily Target 5 | 77.01 |
Daily price and volume Edwards Lifesciences
| Date |
Closing |
Open |
Range |
Volume |
Tue 21 October 2025 |
76.02 (0.97%) |
75.09 |
74.69 - 76.10 |
0.9794 times |
Mon 20 October 2025 |
75.29 (1.06%) |
74.69 |
74.43 - 75.57 |
1.0793 times |
Fri 17 October 2025 |
74.50 (2.55%) |
72.66 |
72.66 - 74.81 |
0.9809 times |
Thu 16 October 2025 |
72.65 (-0.38%) |
73.01 |
72.42 - 73.79 |
0.6805 times |
Wed 15 October 2025 |
72.93 (-0.59%) |
72.77 |
72.40 - 73.83 |
1.1183 times |
Tue 14 October 2025 |
73.36 (0.56%) |
72.77 |
72.47 - 73.52 |
0.9061 times |
Mon 13 October 2025 |
72.95 (-1.34%) |
73.17 |
72.30 - 73.69 |
1.0169 times |
Fri 10 October 2025 |
73.94 (-1.66%) |
75.13 |
73.91 - 75.24 |
0.9705 times |
Thu 09 October 2025 |
75.19 (-0.73%) |
75.76 |
74.72 - 75.88 |
0.8216 times |
Wed 08 October 2025 |
75.74 (-1.28%) |
74.50 |
73.16 - 75.79 |
1.4466 times |
Tue 07 October 2025 |
76.72 (0.21%) |
77.85 |
76.54 - 78.04 |
0.7732 times |
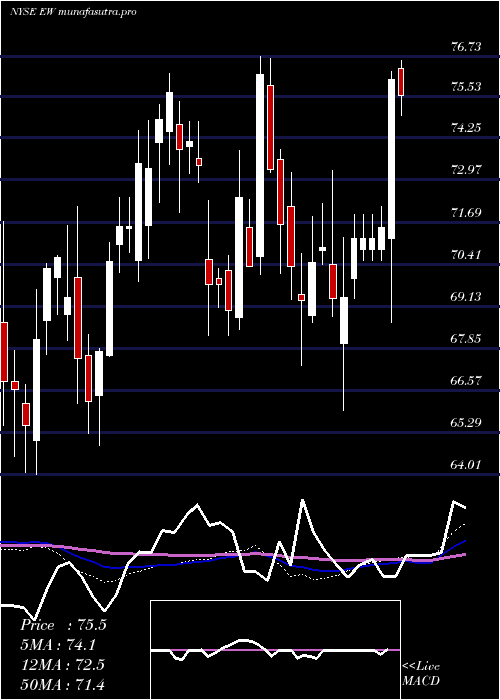
Weekly price and charts EdwardsLifesciences Strong weekly Stock price targets for EdwardsLifesciences EW are 75.23 and 76.9 | Weekly Target 1 | 73.85 | | Weekly Target 2 | 74.93 | | Weekly Target 3 | 75.516666666667 | | Weekly Target 4 | 76.6 | | Weekly Target 5 | 77.19 |
Weekly price and volumes for Edwards Lifesciences
| Date |
Closing |
Open |
Range |
Volume |
Tue 21 October 2025 |
76.02 (2.04%) |
74.69 |
74.43 - 76.10 |
0.4613 times |
Fri 17 October 2025 |
74.50 (0.76%) |
73.17 |
72.30 - 74.81 |
1.0537 times |
Fri 10 October 2025 |
73.94 (-4.06%) |
77.13 |
73.16 - 78.04 |
1.0162 times |
Fri 03 October 2025 |
77.07 (1.08%) |
76.34 |
73.90 - 78.37 |
1.2635 times |
Fri 26 September 2025 |
76.25 (2.47%) |
74.20 |
73.23 - 76.38 |
1.3534 times |
Fri 19 September 2025 |
74.41 (-4.07%) |
77.64 |
73.05 - 78.10 |
1.7494 times |
Fri 12 September 2025 |
77.57 (-4.16%) |
80.57 |
76.49 - 80.79 |
1.1837 times |
Fri 05 September 2025 |
80.94 (-0.49%) |
80.75 |
80.08 - 82.67 |
0.6838 times |
Fri 29 August 2025 |
81.34 (0%) |
81.09 |
80.70 - 81.54 |
0.1588 times |
Fri 29 August 2025 |
81.34 (-0.6%) |
81.76 |
80.02 - 82.23 |
1.0762 times |
Fri 22 August 2025 |
81.83 (4.56%) |
78.12 |
77.65 - 82.26 |
1.4309 times |
Monthly price and charts EdwardsLifesciences Strong monthly Stock price targets for EdwardsLifesciences EW are 71.13 and 77.2 | Monthly Target 1 | 69.49 | | Monthly Target 2 | 72.76 | | Monthly Target 3 | 75.563333333333 | | Monthly Target 4 | 78.83 | | Monthly Target 5 | 81.63 |
Monthly price and volumes Edwards Lifesciences
| Date |
Closing |
Open |
Range |
Volume |
Tue 21 October 2025 |
76.02 (-2.25%) |
77.79 |
72.30 - 78.37 |
0.6482 times |
Tue 30 September 2025 |
77.77 (-4.39%) |
80.75 |
73.05 - 82.67 |
1.0779 times |
Fri 29 August 2025 |
81.34 (2.56%) |
79.02 |
76.07 - 82.26 |
0.8977 times |
Thu 31 July 2025 |
79.31 (1.41%) |
77.70 |
75.30 - 83.00 |
1.2031 times |
Mon 30 June 2025 |
78.21 (-0.01%) |
77.49 |
72.42 - 78.53 |
0.8201 times |
Fri 30 May 2025 |
78.22 (3.62%) |
75.54 |
73.61 - 78.75 |
1.0933 times |
Wed 30 April 2025 |
75.49 (4.15%) |
72.18 |
65.94 - 76.60 |
1.1601 times |
Mon 31 March 2025 |
72.48 (1.2%) |
72.16 |
67.32 - 73.19 |
1.0249 times |
Fri 28 February 2025 |
71.62 (-1.15%) |
71.53 |
70.10 - 76.73 |
0.9102 times |
Fri 31 January 2025 |
72.45 (-2.13%) |
74.31 |
68.23 - 74.74 |
1.1645 times |
Tue 31 December 2024 |
74.03 (3.47%) |
70.51 |
69.89 - 76.23 |
0.9677 times |

DMA SMA EMA moving averages of Edwards Lifesciences EW
DMA (daily moving average) of Edwards Lifesciences EW
| DMA period | DMA value | | 5 day DMA | 74.28 | | 12 day DMA | 74.65 | | 20 day DMA | 75.35 | | 35 day DMA | 76.22 | | 50 day DMA | 77.44 | | 100 day DMA | 77.34 | | 150 day DMA | 75.92 | | 200 day DMA | 74.85 | EMA (exponential moving average) of Edwards Lifesciences EW
| EMA period | EMA current | EMA prev | EMA prev2 | | 5 day EMA | 74.85 | 74.26 | 73.75 | | 12 day EMA | 74.8 | 74.58 | 74.45 | | 20 day EMA | 75.21 | 75.13 | 75.11 | | 35 day EMA | 76.24 | 76.25 | 76.31 | | 50 day EMA | 77.19 | 77.24 | 77.32 |
SMA (simple moving average) of Edwards Lifesciences EW
| SMA period | SMA current | SMA prev | SMA prev2 | | 5 day SMA | 74.28 | 73.75 | 73.28 | | 12 day SMA | 74.65 | 74.74 | 74.86 | | 20 day SMA | 75.35 | 75.28 | 75.2 | | 35 day SMA | 76.22 | 76.38 | 76.56 | | 50 day SMA | 77.44 | 77.46 | 77.52 | | 100 day SMA | 77.34 | 77.35 | 77.36 | | 150 day SMA | 75.92 | 75.89 | 75.85 | | 200 day SMA | 74.85 | 74.84 | 74.82 |
|
|
