EatonVance ETW full analysis,charts,indicators,moving averages,SMA,DMA,EMA,ADX,MACD,RSIEaton Vance ETW WideScreen charts, DMA,SMA,EMA technical analysis, forecast prediction, by indicators ADX,MACD,RSI,CCI NYSE stock exchange
operates under N A sector & deals in N A
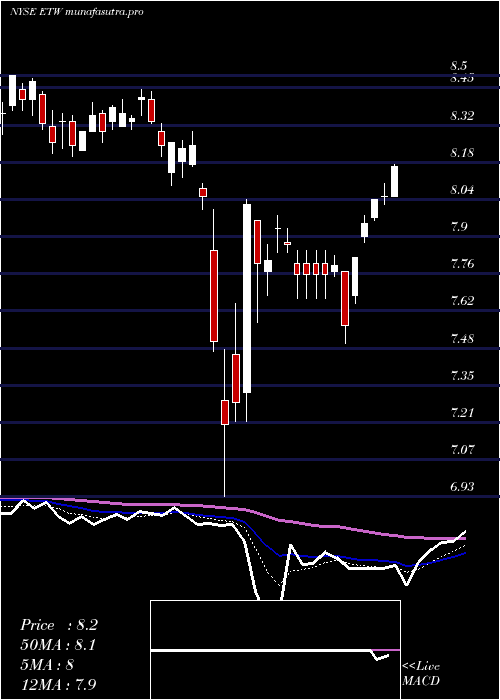
Daily price and charts and targets EatonVance Strong Daily Stock price targets for EatonVance ETW are 9.19 and 9.23 | Daily Target 1 | 9.16 | | Daily Target 2 | 9.19 | | Daily Target 3 | 9.2033333333333 | | Daily Target 4 | 9.23 | | Daily Target 5 | 9.24 |
Daily price and volume Eaton Vance
| Date |
Closing |
Open |
Range |
Volume |
Fri 05 December 2025 |
9.21 (0.33%) |
9.21 |
9.18 - 9.22 |
0.7321 times |
Thu 04 December 2025 |
9.18 (0.33%) |
9.18 |
9.15 - 9.20 |
1.0113 times |
Wed 03 December 2025 |
9.15 (0.11%) |
9.14 |
9.12 - 9.16 |
0.857 times |
Tue 02 December 2025 |
9.14 (0.44%) |
9.15 |
9.09 - 9.15 |
0.8031 times |
Mon 01 December 2025 |
9.10 (-0.76%) |
9.14 |
9.10 - 9.14 |
0.8408 times |
Fri 28 November 2025 |
9.17 (0.99%) |
9.13 |
9.11 - 9.17 |
0.7608 times |
Wed 26 November 2025 |
9.08 (0.44%) |
9.08 |
9.05 - 9.11 |
1.3921 times |
Tue 25 November 2025 |
9.04 (0.89%) |
8.98 |
8.95 - 9.05 |
0.9062 times |
Mon 24 November 2025 |
8.96 (1.93%) |
8.86 |
8.84 - 8.98 |
1.4024 times |
Fri 21 November 2025 |
8.79 (1.03%) |
8.72 |
8.72 - 8.85 |
1.2942 times |
Thu 20 November 2025 |
8.70 (-0.8%) |
8.88 |
8.67 - 8.92 |
1.8742 times |
Weekly price and charts EatonVance Strong weekly Stock price targets for EatonVance ETW are 9.15 and 9.28 | Weekly Target 1 | 9.04 | | Weekly Target 2 | 9.13 | | Weekly Target 3 | 9.1733333333333 | | Weekly Target 4 | 9.26 | | Weekly Target 5 | 9.3 |
Weekly price and volumes for Eaton Vance
| Date |
Closing |
Open |
Range |
Volume |
Fri 05 December 2025 |
9.21 (0.44%) |
9.14 |
9.09 - 9.22 |
0.9784 times |
Fri 28 November 2025 |
9.17 (4.32%) |
8.86 |
8.84 - 9.17 |
1.0284 times |
Fri 21 November 2025 |
8.79 (-1.9%) |
8.97 |
8.67 - 8.99 |
1.3459 times |
Fri 14 November 2025 |
8.96 (-0.44%) |
9.03 |
8.86 - 9.19 |
0.9632 times |
Fri 07 November 2025 |
9.00 (-1.21%) |
9.02 |
8.94 - 9.08 |
0.8027 times |
Fri 31 October 2025 |
9.11 (0%) |
9.05 |
9.05 - 9.11 |
0.2694 times |
Fri 31 October 2025 |
9.11 (0.66%) |
9.08 |
8.99 - 9.12 |
1.0938 times |
Fri 24 October 2025 |
9.05 (0.22%) |
9.07 |
8.98 - 9.15 |
1.4445 times |
Fri 17 October 2025 |
9.03 (1.23%) |
9.01 |
8.96 - 9.11 |
0.9702 times |
Fri 10 October 2025 |
8.92 (-2.51%) |
9.15 |
8.88 - 9.22 |
1.1034 times |
Fri 03 October 2025 |
9.15 (2.46%) |
8.95 |
8.95 - 9.25 |
1.1725 times |
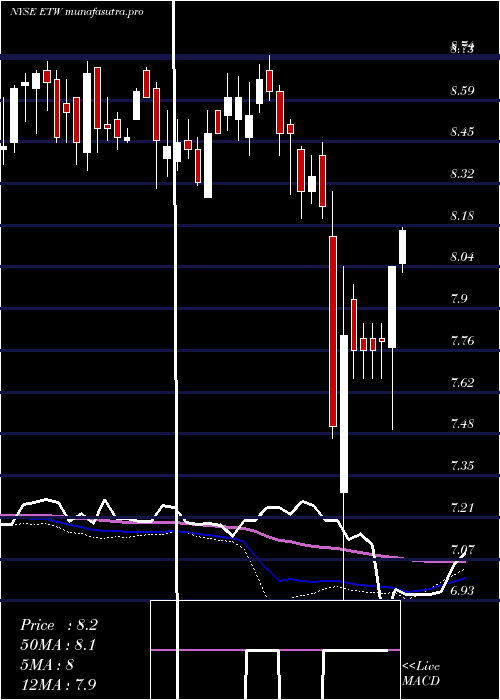
Monthly price and charts EatonVance Strong monthly Stock price targets for EatonVance ETW are 9.15 and 9.28 | Monthly Target 1 | 9.04 | | Monthly Target 2 | 9.13 | | Monthly Target 3 | 9.1733333333333 | | Monthly Target 4 | 9.26 | | Monthly Target 5 | 9.3 |
Monthly price and volumes Eaton Vance
| Date |
Closing |
Open |
Range |
Volume |
Fri 05 December 2025 |
9.21 (0.44%) |
9.14 |
9.09 - 9.22 |
0.2452 times |
Fri 28 November 2025 |
9.17 (0.66%) |
9.02 |
8.67 - 9.19 |
1.0376 times |
Fri 31 October 2025 |
9.11 (0.66%) |
9.03 |
8.88 - 9.25 |
1.4222 times |
Tue 30 September 2025 |
9.05 (0.56%) |
8.95 |
8.85 - 9.11 |
0.8629 times |
Fri 29 August 2025 |
9.00 (3.81%) |
8.61 |
8.50 - 9.02 |
0.9223 times |
Thu 31 July 2025 |
8.67 (0.23%) |
8.61 |
8.50 - 8.77 |
0.9847 times |
Mon 30 June 2025 |
8.65 (2.85%) |
8.40 |
8.28 - 8.65 |
0.8722 times |
Fri 30 May 2025 |
8.41 (3.44%) |
8.20 |
8.15 - 8.42 |
0.9359 times |
Wed 30 April 2025 |
8.13 (-1.45%) |
8.18 |
6.93 - 8.29 |
1.7173 times |
Mon 31 March 2025 |
8.25 (-2.71%) |
8.51 |
8.09 - 8.53 |
0.9998 times |
Fri 28 February 2025 |
8.48 (-1.4%) |
8.47 |
8.41 - 8.74 |
0.8225 times |

DMA SMA EMA moving averages of Eaton Vance ETW
DMA (daily moving average) of Eaton Vance ETW
| DMA period | DMA value | | 5 day DMA | 9.16 | | 12 day DMA | 9.02 | | 20 day DMA | 9.02 | | 35 day DMA | 9.04 | | 50 day DMA | 9.05 | | 100 day DMA | 8.97 | | 150 day DMA | 8.79 | | 200 day DMA | 8.63 | EMA (exponential moving average) of Eaton Vance ETW
| EMA period | EMA current | EMA prev | EMA prev2 | | 5 day EMA | 9.16 | 9.13 | 9.11 | | 12 day EMA | 9.09 | 9.07 | 9.05 | | 20 day EMA | 9.06 | 9.04 | 9.03 | | 35 day EMA | 9.06 | 9.05 | 9.04 | | 50 day EMA | 9.06 | 9.05 | 9.04 |
SMA (simple moving average) of Eaton Vance ETW
| SMA period | SMA current | SMA prev | SMA prev2 | | 5 day SMA | 9.16 | 9.15 | 9.13 | | 12 day SMA | 9.02 | 8.99 | 8.97 | | 20 day SMA | 9.02 | 9.01 | 9 | | 35 day SMA | 9.04 | 9.04 | 9.03 | | 50 day SMA | 9.05 | 9.05 | 9.04 | | 100 day SMA | 8.97 | 8.96 | 8.96 | | 150 day SMA | 8.79 | 8.79 | 8.78 | | 200 day SMA | 8.63 | 8.63 | 8.63 |
|
|
