EnergyTransfer ET full analysis,charts,indicators,moving averages,SMA,DMA,EMA,ADX,MACD,RSIEnergy Transfer ET WideScreen charts, DMA,SMA,EMA technical analysis, forecast prediction, by indicators ADX,MACD,RSI,CCI NYSE stock exchange
operates under Public Utilities sector & deals in Natural Gas Distribution
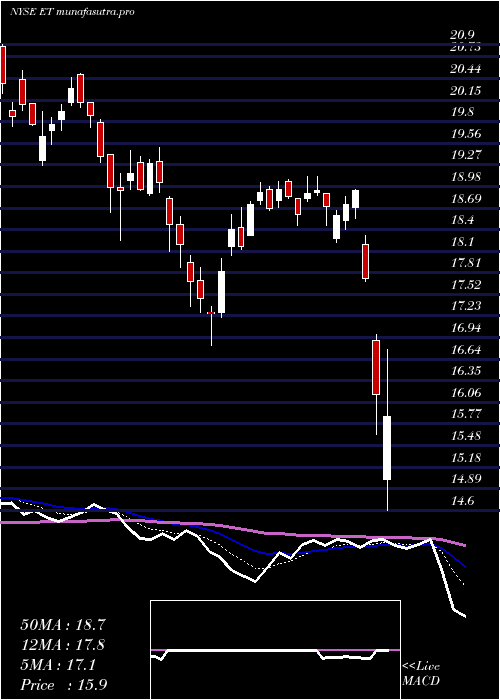
Daily price and charts and targets EnergyTransfer Strong Daily Stock price targets for EnergyTransfer ET are 16.76 and 16.98 | Daily Target 1 | 16.59 | | Daily Target 2 | 16.7 | | Daily Target 3 | 16.813333333333 | | Daily Target 4 | 16.92 | | Daily Target 5 | 17.03 |
Daily price and volume Energy Transfer
| Date |
Closing |
Open |
Range |
Volume |
Fri 05 December 2025 |
16.80 (0%) |
16.77 |
16.71 - 16.93 |
0.958 times |
Thu 04 December 2025 |
16.80 (0.54%) |
16.76 |
16.69 - 16.82 |
0.7631 times |
Wed 03 December 2025 |
16.71 (0.91%) |
16.60 |
16.60 - 16.79 |
0.845 times |
Tue 02 December 2025 |
16.56 (-1.6%) |
16.88 |
16.56 - 16.92 |
0.8837 times |
Mon 01 December 2025 |
16.83 (0.72%) |
16.70 |
16.67 - 16.87 |
1.0519 times |
Fri 28 November 2025 |
16.71 (1.64%) |
16.47 |
16.43 - 16.72 |
0.4954 times |
Wed 26 November 2025 |
16.44 (1.04%) |
16.33 |
16.26 - 16.50 |
1.1873 times |
Tue 25 November 2025 |
16.27 (-1.33%) |
16.63 |
16.26 - 16.63 |
1.1592 times |
Mon 24 November 2025 |
16.49 (-0.12%) |
16.58 |
16.34 - 16.63 |
1.0097 times |
Fri 21 November 2025 |
16.51 (-0.78%) |
16.56 |
16.33 - 16.66 |
1.6467 times |
Thu 20 November 2025 |
16.64 (-1.65%) |
16.97 |
16.48 - 16.99 |
1.4296 times |
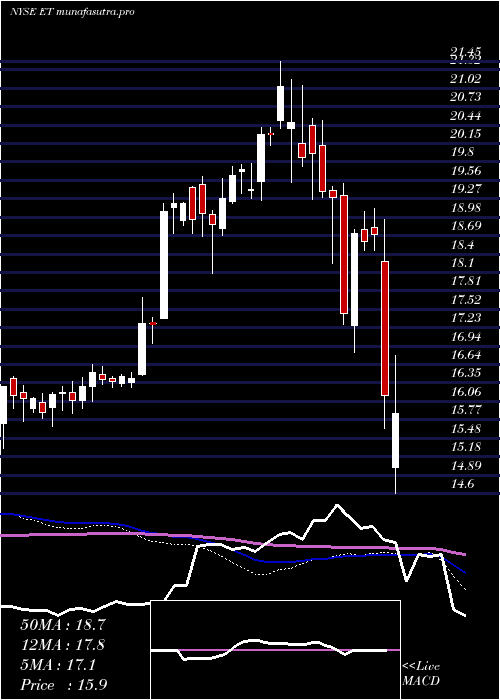
Weekly price and charts EnergyTransfer Strong weekly Stock price targets for EnergyTransfer ET are 16.68 and 17.05 | Weekly Target 1 | 16.39 | | Weekly Target 2 | 16.6 | | Weekly Target 3 | 16.763333333333 | | Weekly Target 4 | 16.97 | | Weekly Target 5 | 17.13 |
Weekly price and volumes for Energy Transfer
| Date |
Closing |
Open |
Range |
Volume |
Fri 05 December 2025 |
16.80 (0.54%) |
16.70 |
16.56 - 16.93 |
1.0294 times |
Fri 28 November 2025 |
16.71 (1.21%) |
16.58 |
16.26 - 16.72 |
0.8807 times |
Fri 21 November 2025 |
16.51 (-2.94%) |
16.99 |
16.33 - 17.11 |
1.3804 times |
Fri 14 November 2025 |
17.01 (3.4%) |
16.45 |
16.26 - 17.03 |
1.0424 times |
Fri 07 November 2025 |
16.45 (-2.26%) |
16.83 |
16.18 - 17.06 |
1.0137 times |
Fri 31 October 2025 |
16.83 (0%) |
16.80 |
16.69 - 16.89 |
0.1665 times |
Fri 31 October 2025 |
16.83 (0.6%) |
16.75 |
16.69 - 17.04 |
0.9747 times |
Fri 24 October 2025 |
16.73 (1.64%) |
16.48 |
16.46 - 17.11 |
1.0243 times |
Fri 17 October 2025 |
16.46 (1.04%) |
16.37 |
16.23 - 16.99 |
1.1483 times |
Fri 10 October 2025 |
16.29 (-3.67%) |
16.92 |
16.26 - 16.95 |
1.3395 times |
Fri 03 October 2025 |
16.91 (-3.15%) |
17.48 |
16.80 - 17.50 |
1.1385 times |
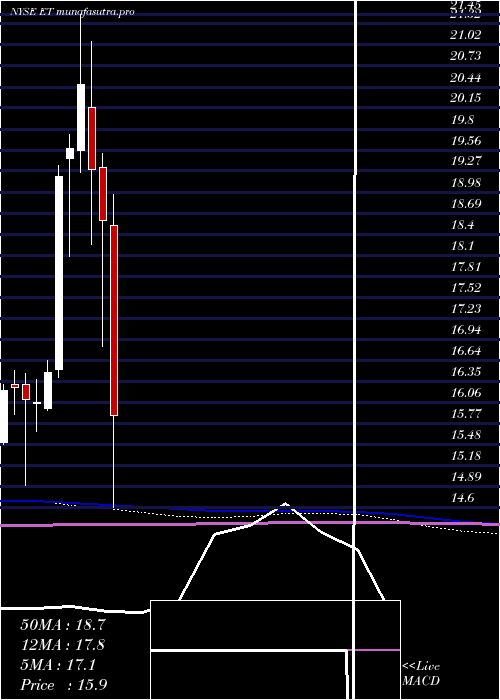
Monthly price and charts EnergyTransfer Strong monthly Stock price targets for EnergyTransfer ET are 16.68 and 17.05 | Monthly Target 1 | 16.39 | | Monthly Target 2 | 16.6 | | Monthly Target 3 | 16.763333333333 | | Monthly Target 4 | 16.97 | | Monthly Target 5 | 17.13 |
Monthly price and volumes Energy Transfer
| Date |
Closing |
Open |
Range |
Volume |
Fri 05 December 2025 |
16.80 (0.54%) |
16.70 |
16.56 - 16.93 |
0.2381 times |
Fri 28 November 2025 |
16.71 (-0.71%) |
16.83 |
16.18 - 17.11 |
0.9987 times |
Fri 31 October 2025 |
16.83 (-1.92%) |
17.10 |
16.23 - 17.11 |
1.2197 times |
Tue 30 September 2025 |
17.16 (-3.16%) |
17.68 |
16.95 - 17.85 |
0.8752 times |
Fri 29 August 2025 |
17.72 (-1.77%) |
17.99 |
17.09 - 18.12 |
1.0806 times |
Thu 31 July 2025 |
18.04 (-0.5%) |
18.15 |
17.14 - 18.18 |
0.9859 times |
Mon 30 June 2025 |
18.13 (3.72%) |
17.54 |
17.34 - 18.71 |
0.9476 times |
Fri 30 May 2025 |
17.48 (5.68%) |
16.69 |
15.80 - 18.19 |
1.1024 times |
Wed 30 April 2025 |
16.54 (-11.03%) |
18.52 |
14.60 - 18.94 |
1.4247 times |
Mon 31 March 2025 |
18.59 (-3.63%) |
19.32 |
16.83 - 19.51 |
1.1272 times |
Fri 28 February 2025 |
19.29 (-5.81%) |
20.15 |
18.25 - 21.07 |
1.1093 times |
DMA SMA EMA moving averages of Energy Transfer ET
DMA (daily moving average) of Energy Transfer ET
| DMA period | DMA value | | 5 day DMA | 16.74 | | 12 day DMA | 16.64 | | 20 day DMA | 16.68 | | 35 day DMA | 16.74 | | 50 day DMA | 16.76 | | 100 day DMA | 17.14 | | 150 day DMA | 17.32 | | 200 day DMA | 17.44 | EMA (exponential moving average) of Energy Transfer ET
| EMA period | EMA current | EMA prev | EMA prev2 | | 5 day EMA | 16.73 | 16.7 | 16.65 | | 12 day EMA | 16.69 | 16.67 | 16.65 | | 20 day EMA | 16.7 | 16.69 | 16.68 | | 35 day EMA | 16.74 | 16.74 | 16.74 | | 50 day EMA | 16.8 | 16.8 | 16.8 |
SMA (simple moving average) of Energy Transfer ET
| SMA period | SMA current | SMA prev | SMA prev2 | | 5 day SMA | 16.74 | 16.72 | 16.65 | | 12 day SMA | 16.64 | 16.65 | 16.67 | | 20 day SMA | 16.68 | 16.69 | 16.69 | | 35 day SMA | 16.74 | 16.73 | 16.74 | | 50 day SMA | 16.76 | 16.77 | 16.78 | | 100 day SMA | 17.14 | 17.14 | 17.15 | | 150 day SMA | 17.32 | 17.32 | 17.32 | | 200 day SMA | 17.44 | 17.45 | 17.47 |
|
|
