ElasticN ESTC full analysis,charts,indicators,moving averages,SMA,DMA,EMA,ADX,MACD,RSIElastic N ESTC WideScreen charts, DMA,SMA,EMA technical analysis, forecast prediction, by indicators ADX,MACD,RSI,CCI NYSE stock exchange
operates under Technology sector & deals in Computer Software Prepackaged Software
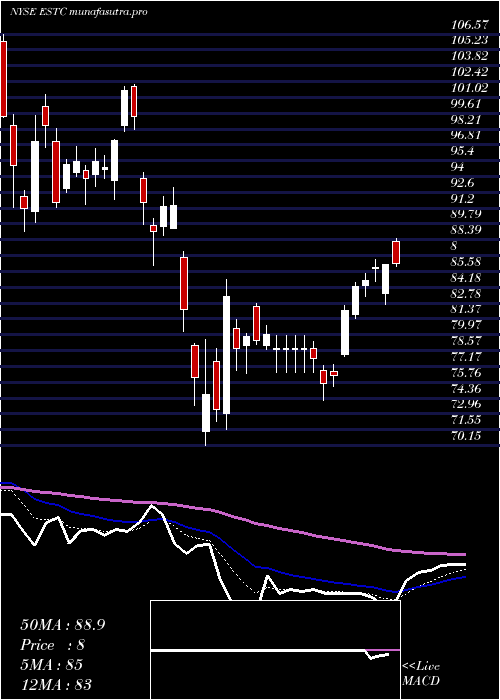
Daily price and charts and targets ElasticN Strong Daily Stock price targets for ElasticN ESTC are 72.47 and 74.61 | Daily Target 1 | 72.04 | | Daily Target 2 | 72.89 | | Daily Target 3 | 74.183333333333 | | Daily Target 4 | 75.03 | | Daily Target 5 | 76.32 |
Daily price and volume Elastic N
| Date |
Closing |
Open |
Range |
Volume |
Thu 04 December 2025 |
73.73 (-1.72%) |
75.00 |
73.34 - 75.48 |
0.6002 times |
Wed 03 December 2025 |
75.02 (3.81%) |
73.50 |
73.33 - 75.50 |
0.6939 times |
Tue 02 December 2025 |
72.27 (1.66%) |
71.62 |
71.20 - 73.44 |
0.3375 times |
Mon 01 December 2025 |
71.09 (0.79%) |
69.40 |
69.40 - 71.22 |
0.6857 times |
Fri 28 November 2025 |
70.53 (0.84%) |
69.97 |
69.97 - 71.27 |
0.3365 times |
Wed 26 November 2025 |
69.94 (0.59%) |
69.24 |
68.91 - 70.98 |
0.7802 times |
Tue 25 November 2025 |
69.53 (0.68%) |
69.26 |
68.10 - 70.09 |
1.3567 times |
Mon 24 November 2025 |
69.06 (-1.4%) |
70.05 |
68.88 - 71.24 |
0.648 times |
Fri 21 November 2025 |
70.04 (-14.67%) |
72.56 |
68.78 - 76.00 |
3.2102 times |
Thu 20 November 2025 |
82.08 (-7.02%) |
89.13 |
81.83 - 91.09 |
1.351 times |
Wed 19 November 2025 |
88.28 (-0.32%) |
88.05 |
87.54 - 89.84 |
0.5568 times |
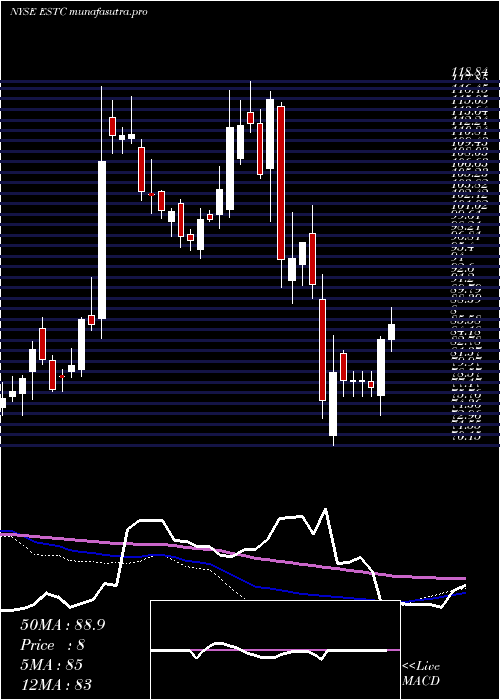
Weekly price and charts ElasticN Strong weekly Stock price targets for ElasticN ESTC are 71.57 and 77.67 | Weekly Target 1 | 66.78 | | Weekly Target 2 | 70.25 | | Weekly Target 3 | 72.876666666667 | | Weekly Target 4 | 76.35 | | Weekly Target 5 | 78.98 |
Weekly price and volumes for Elastic N
| Date |
Closing |
Open |
Range |
Volume |
Thu 04 December 2025 |
73.73 (4.54%) |
69.40 |
69.40 - 75.50 |
0.7931 times |
Fri 28 November 2025 |
70.53 (0.7%) |
70.05 |
68.10 - 71.27 |
1.0684 times |
Fri 21 November 2025 |
70.04 (-22.89%) |
90.21 |
68.78 - 91.09 |
2.1969 times |
Fri 14 November 2025 |
90.83 (0.9%) |
89.99 |
87.51 - 96.07 |
0.8984 times |
Fri 07 November 2025 |
90.02 (0.9%) |
88.31 |
84.84 - 90.10 |
0.6836 times |
Fri 31 October 2025 |
89.22 (0%) |
89.24 |
88.50 - 90.69 |
0.1633 times |
Fri 31 October 2025 |
89.22 (1.16%) |
89.20 |
85.71 - 90.69 |
0.7772 times |
Fri 24 October 2025 |
88.20 (8.67%) |
81.47 |
81.47 - 90.07 |
0.846 times |
Fri 17 October 2025 |
81.16 (-6.15%) |
87.22 |
78.90 - 87.77 |
1.2112 times |
Fri 10 October 2025 |
86.48 (0.73%) |
86.06 |
79.63 - 92.96 |
1.3618 times |
Fri 03 October 2025 |
85.85 (-0.12%) |
86.46 |
82.80 - 89.07 |
0.7269 times |
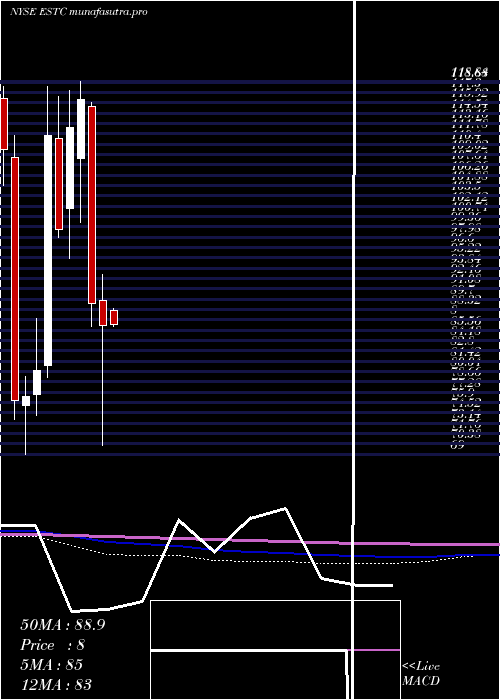
Monthly price and charts ElasticN Strong monthly Stock price targets for ElasticN ESTC are 71.57 and 77.67 | Monthly Target 1 | 66.78 | | Monthly Target 2 | 70.25 | | Monthly Target 3 | 72.876666666667 | | Monthly Target 4 | 76.35 | | Monthly Target 5 | 78.98 |
Monthly price and volumes Elastic N
| Date |
Closing |
Open |
Range |
Volume |
Thu 04 December 2025 |
73.73 (4.54%) |
69.40 |
69.40 - 75.50 |
0.1812 times |
Fri 28 November 2025 |
70.53 (-20.95%) |
88.31 |
68.10 - 96.07 |
1.1077 times |
Fri 31 October 2025 |
89.22 (5.6%) |
83.12 |
78.90 - 92.96 |
1.0868 times |
Tue 30 September 2025 |
84.49 (-0.67%) |
83.80 |
82.69 - 92.95 |
1.0477 times |
Fri 29 August 2025 |
85.06 (1.62%) |
82.17 |
72.07 - 94.44 |
1.5603 times |
Thu 31 July 2025 |
83.70 (-0.75%) |
83.86 |
82.45 - 91.12 |
0.7533 times |
Mon 30 June 2025 |
84.33 (4.28%) |
80.87 |
78.69 - 87.84 |
1.027 times |
Fri 30 May 2025 |
80.87 (-6.18%) |
88.20 |
77.00 - 95.15 |
1.35 times |
Wed 30 April 2025 |
86.20 (-3.25%) |
89.57 |
70.15 - 93.04 |
1.0363 times |
Mon 31 March 2025 |
89.10 (-23.43%) |
115.39 |
86.08 - 116.00 |
0.8496 times |
Fri 28 February 2025 |
116.36 (3.36%) |
108.48 |
100.00 - 118.84 |
0.7074 times |
DMA SMA EMA moving averages of Elastic N ESTC
DMA (daily moving average) of Elastic N ESTC
| DMA period | DMA value | | 5 day DMA | 72.53 | | 12 day DMA | 75.01 | | 20 day DMA | 81.32 | | 35 day DMA | 83.56 | | 50 day DMA | 83.79 | | 100 day DMA | 83.88 | | 150 day DMA | 84.67 | | 200 day DMA | 86.33 | EMA (exponential moving average) of Elastic N ESTC
| EMA period | EMA current | EMA prev | EMA prev2 | | 5 day EMA | 73.24 | 72.99 | 71.98 | | 12 day EMA | 75.63 | 75.97 | 76.14 | | 20 day EMA | 78.43 | 78.92 | 79.33 | | 35 day EMA | 81.01 | 81.44 | 81.82 | | 50 day EMA | 83.04 | 83.42 | 83.76 |
SMA (simple moving average) of Elastic N ESTC
| SMA period | SMA current | SMA prev | SMA prev2 | | 5 day SMA | 72.53 | 71.77 | 70.67 | | 12 day SMA | 75.01 | 76.15 | 77.47 | | 20 day SMA | 81.32 | 81.98 | 82.66 | | 35 day SMA | 83.56 | 83.75 | 83.94 | | 50 day SMA | 83.79 | 84.04 | 84.27 | | 100 day SMA | 83.88 | 83.98 | 84.08 | | 150 day SMA | 84.67 | 84.75 | 84.83 | | 200 day SMA | 86.33 | 86.54 | 86.73 |
|
|
