EssexProperty ESS full analysis,charts,indicators,moving averages,SMA,DMA,EMA,ADX,MACD,RSIEssex Property ESS WideScreen charts, DMA,SMA,EMA technical analysis, forecast prediction, by indicators ADX,MACD,RSI,CCI NYSE stock exchange
operates under Consumer Services sector & deals in Real Estate Investment Trusts
Daily price and charts and targets EssexProperty Strong Daily Stock price targets for EssexProperty ESS are 254.9 and 259.84 | Daily Target 1 | 254 | | Daily Target 2 | 255.79 | | Daily Target 3 | 258.94333333333 | | Daily Target 4 | 260.73 | | Daily Target 5 | 263.88 |
Daily price and volume Essex Property
| Date |
Closing |
Open |
Range |
Volume |
Thu 04 December 2025 |
257.57 (-0.85%) |
259.98 |
257.16 - 262.10 |
1.0207 times |
Wed 03 December 2025 |
259.78 (-0.36%) |
260.33 |
259.57 - 262.87 |
1.1832 times |
Tue 02 December 2025 |
260.73 (0.19%) |
260.54 |
258.24 - 261.71 |
1.1276 times |
Mon 01 December 2025 |
260.24 (-1.28%) |
261.43 |
260.06 - 263.91 |
1.1811 times |
Fri 28 November 2025 |
263.62 (0.57%) |
261.84 |
261.17 - 264.70 |
0.3658 times |
Wed 26 November 2025 |
262.12 (0.37%) |
259.65 |
259.65 - 263.77 |
0.6807 times |
Tue 25 November 2025 |
261.16 (0.35%) |
260.16 |
259.75 - 263.59 |
0.9875 times |
Mon 24 November 2025 |
260.25 (-0.36%) |
260.76 |
259.10 - 262.10 |
1.2666 times |
Fri 21 November 2025 |
261.20 (2.14%) |
256.10 |
256.10 - 262.17 |
1.0097 times |
Thu 20 November 2025 |
255.73 (0.43%) |
257.12 |
254.98 - 258.61 |
1.1772 times |
Wed 19 November 2025 |
254.63 (0.41%) |
254.41 |
251.45 - 255.94 |
0.6485 times |
Weekly price and charts EssexProperty Strong weekly Stock price targets for EssexProperty ESS are 253.99 and 260.74 | Weekly Target 1 | 252.8 | | Weekly Target 2 | 255.18 | | Weekly Target 3 | 259.54666666667 | | Weekly Target 4 | 261.93 | | Weekly Target 5 | 266.3 |
Weekly price and volumes for Essex Property
| Date |
Closing |
Open |
Range |
Volume |
Thu 04 December 2025 |
257.57 (-2.29%) |
261.43 |
257.16 - 263.91 |
0.8879 times |
Fri 28 November 2025 |
263.62 (0.93%) |
260.76 |
259.10 - 264.70 |
0.6494 times |
Fri 21 November 2025 |
261.20 (2.6%) |
255.74 |
251.14 - 262.17 |
0.9109 times |
Fri 14 November 2025 |
254.59 (-2.24%) |
259.21 |
252.02 - 263.13 |
1.3241 times |
Fri 07 November 2025 |
260.42 (3.44%) |
253.84 |
252.05 - 261.51 |
1.1104 times |
Fri 31 October 2025 |
251.77 (0%) |
249.51 |
248.17 - 257.17 |
0.4362 times |
Fri 31 October 2025 |
251.77 (-4.87%) |
264.62 |
243.25 - 264.62 |
1.9055 times |
Fri 24 October 2025 |
264.66 (1.94%) |
260.41 |
258.80 - 266.58 |
1.1384 times |
Fri 17 October 2025 |
259.62 (-0.94%) |
255.86 |
254.42 - 263.06 |
1.3984 times |
Tue 07 October 2025 |
262.08 (-0.9%) |
264.70 |
260.25 - 264.70 |
0.2386 times |
Fri 03 October 2025 |
264.47 (-1.24%) |
264.82 |
262.33 - 270.49 |
0.8817 times |
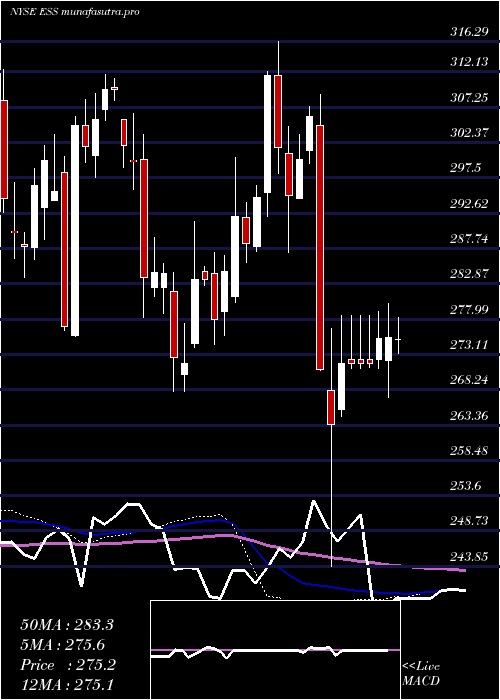
Monthly price and charts EssexProperty Strong monthly Stock price targets for EssexProperty ESS are 253.99 and 260.74 | Monthly Target 1 | 252.8 | | Monthly Target 2 | 255.18 | | Monthly Target 3 | 259.54666666667 | | Monthly Target 4 | 261.93 | | Monthly Target 5 | 266.3 |
Monthly price and volumes Essex Property
| Date |
Closing |
Open |
Range |
Volume |
Thu 04 December 2025 |
257.57 (-2.29%) |
261.43 |
257.16 - 263.91 |
0.1981 times |
Fri 28 November 2025 |
263.62 (4.71%) |
253.84 |
251.14 - 264.70 |
0.8913 times |
Fri 31 October 2025 |
251.77 (-5.94%) |
268.66 |
243.25 - 270.49 |
1.2475 times |
Tue 30 September 2025 |
267.66 (-0.94%) |
268.26 |
258.82 - 270.84 |
0.9443 times |
Fri 29 August 2025 |
270.21 (3.86%) |
264.22 |
250.81 - 270.68 |
1.1333 times |
Thu 31 July 2025 |
260.18 (-8.19%) |
283.33 |
258.80 - 294.09 |
1.3294 times |
Mon 30 June 2025 |
283.40 (-0.18%) |
281.56 |
276.32 - 291.02 |
1.1026 times |
Fri 30 May 2025 |
283.90 (1.7%) |
279.19 |
269.10 - 293.85 |
0.984 times |
Wed 30 April 2025 |
279.15 (-8.94%) |
306.99 |
243.85 - 308.52 |
1.1868 times |
Mon 31 March 2025 |
306.57 (-1.6%) |
311.64 |
287.22 - 316.29 |
0.9826 times |
Fri 28 February 2025 |
311.57 (9.49%) |
281.12 |
280.33 - 312.10 |
1.0781 times |

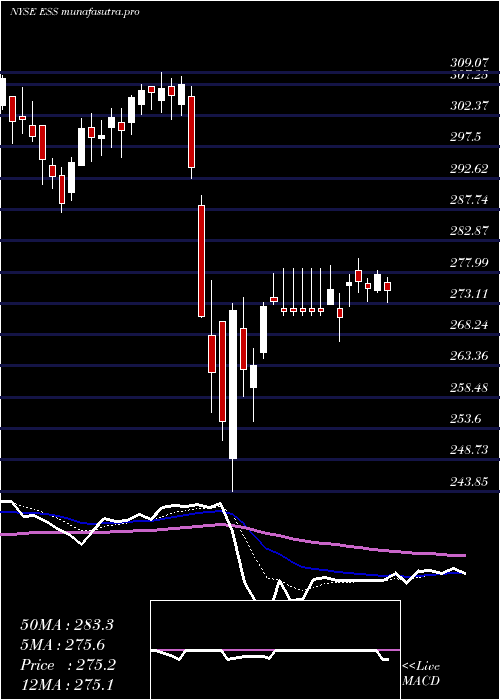
DMA SMA EMA moving averages of Essex Property ESS
DMA (daily moving average) of Essex Property ESS
| DMA period | DMA value | | 5 day DMA | 260.39 | | 12 day DMA | 259.22 | | 20 day DMA | 258.23 | | 35 day DMA | 258.09 | | 50 day DMA | 259.8 | | 100 day DMA | 264.47 | | 150 day DMA | 270.71 | | 200 day DMA | 275.43 | EMA (exponential moving average) of Essex Property ESS
| EMA period | EMA current | EMA prev | EMA prev2 | | 5 day EMA | 259.52 | 260.5 | 260.86 | | 12 day EMA | 259.28 | 259.59 | 259.55 | | 20 day EMA | 258.92 | 259.06 | 258.98 | | 35 day EMA | 259.61 | 259.73 | 259.73 | | 50 day EMA | 260.39 | 260.51 | 260.54 |
SMA (simple moving average) of Essex Property ESS
| SMA period | SMA current | SMA prev | SMA prev2 | | 5 day SMA | 260.39 | 261.3 | 261.57 | | 12 day SMA | 259.22 | 258.78 | 258.35 | | 20 day SMA | 258.23 | 258.37 | 258.21 | | 35 day SMA | 258.09 | 258.08 | 258.07 | | 50 day SMA | 259.8 | 260 | 260.17 | | 100 day SMA | 264.47 | 264.76 | 265.01 | | 150 day SMA | 270.71 | 270.83 | 270.94 | | 200 day SMA | 275.43 | 275.6 | 275.75 |
|
|
