EmpireState ESRT full analysis,charts,indicators,moving averages,SMA,DMA,EMA,ADX,MACD,RSIEmpire State ESRT WideScreen charts, DMA,SMA,EMA technical analysis, forecast prediction, by indicators ADX,MACD,RSI,CCI NYSE stock exchange
operates under Consumer Services sector & deals in Real Estate Investment Trusts
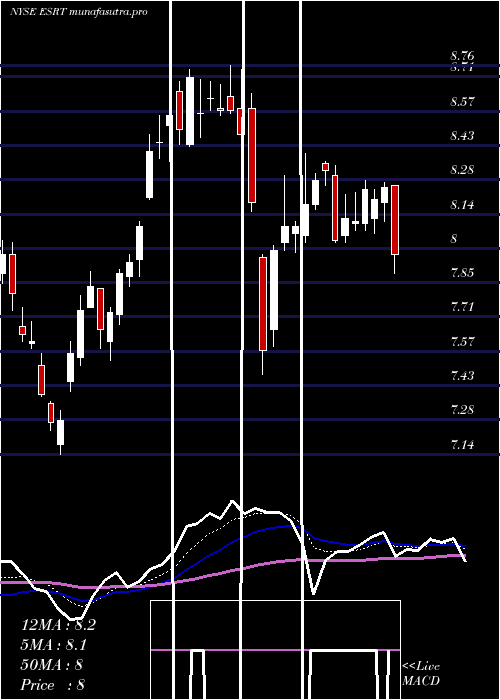
Daily price and charts and targets EmpireState Strong Daily Stock price targets for EmpireState ESRT are 7.05 and 7.31 | Daily Target 1 | 6.98 | | Daily Target 2 | 7.11 | | Daily Target 3 | 7.2366666666667 | | Daily Target 4 | 7.37 | | Daily Target 5 | 7.5 |
Daily price and volume Empire State
| Date |
Closing |
Open |
Range |
Volume |
Mon 20 October 2025 |
7.25 (-0.28%) |
7.29 |
7.10 - 7.36 |
0.9887 times |
Fri 17 October 2025 |
7.27 (1.54%) |
7.13 |
7.13 - 7.32 |
1.0055 times |
Thu 16 October 2025 |
7.16 (-3.24%) |
7.38 |
7.16 - 7.41 |
1.0743 times |
Wed 15 October 2025 |
7.40 (2.07%) |
7.23 |
7.19 - 7.46 |
1.5682 times |
Tue 14 October 2025 |
7.25 (0.42%) |
7.18 |
7.17 - 7.31 |
0.8552 times |
Mon 13 October 2025 |
7.22 (-6.96%) |
7.21 |
7.12 - 7.25 |
0.7007 times |
Tue 07 October 2025 |
7.76 (-0.26%) |
7.78 |
7.73 - 7.88 |
1.4242 times |
Mon 06 October 2025 |
7.78 (0.13%) |
7.79 |
7.72 - 7.81 |
0.7262 times |
Fri 03 October 2025 |
7.77 (0.26%) |
7.79 |
7.75 - 7.87 |
0.5773 times |
Thu 02 October 2025 |
7.75 (0.65%) |
7.74 |
7.66 - 7.79 |
1.0798 times |
Wed 01 October 2025 |
7.70 (0.52%) |
7.63 |
7.63 - 7.76 |
0.9425 times |
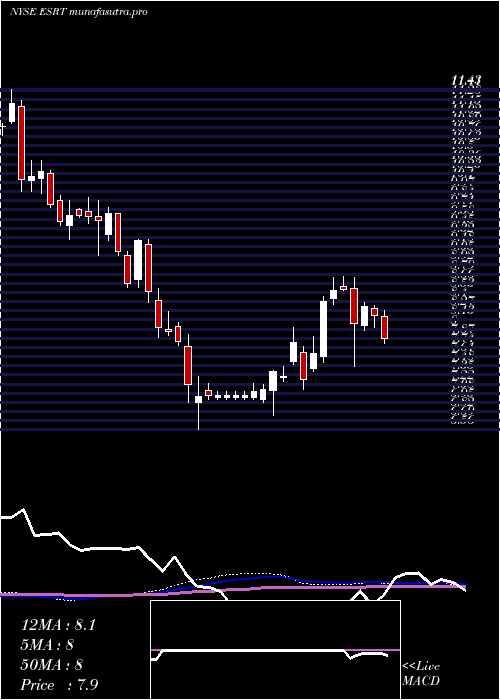
Weekly price and charts EmpireState Strong weekly Stock price targets for EmpireState ESRT are 7.05 and 7.31 | Weekly Target 1 | 6.98 | | Weekly Target 2 | 7.11 | | Weekly Target 3 | 7.2366666666667 | | Weekly Target 4 | 7.37 | | Weekly Target 5 | 7.5 |
Weekly price and volumes for Empire State
| Date |
Closing |
Open |
Range |
Volume |
Mon 20 October 2025 |
7.25 (-0.28%) |
7.29 |
7.10 - 7.36 |
0.2736 times |
Fri 17 October 2025 |
7.27 (-6.31%) |
7.21 |
7.12 - 7.46 |
1.4402 times |
Tue 07 October 2025 |
7.76 (-0.13%) |
7.79 |
7.72 - 7.88 |
0.5951 times |
Fri 03 October 2025 |
7.77 (1.57%) |
7.67 |
7.60 - 7.87 |
1.3065 times |
Fri 26 September 2025 |
7.65 (2.96%) |
7.40 |
7.33 - 7.77 |
1.6382 times |
Fri 19 September 2025 |
7.43 (-6.07%) |
7.90 |
7.37 - 7.95 |
1.4367 times |
Fri 12 September 2025 |
7.91 (-0.75%) |
7.80 |
7.56 - 7.96 |
1.0825 times |
Fri 05 September 2025 |
7.97 (4.18%) |
7.60 |
7.47 - 8.07 |
0.9378 times |
Fri 29 August 2025 |
7.65 (0%) |
7.61 |
7.60 - 7.71 |
0.2624 times |
Fri 29 August 2025 |
7.65 (-0.13%) |
7.62 |
7.45 - 7.71 |
1.027 times |
Fri 22 August 2025 |
7.66 (3.1%) |
7.43 |
7.25 - 7.74 |
0.9431 times |
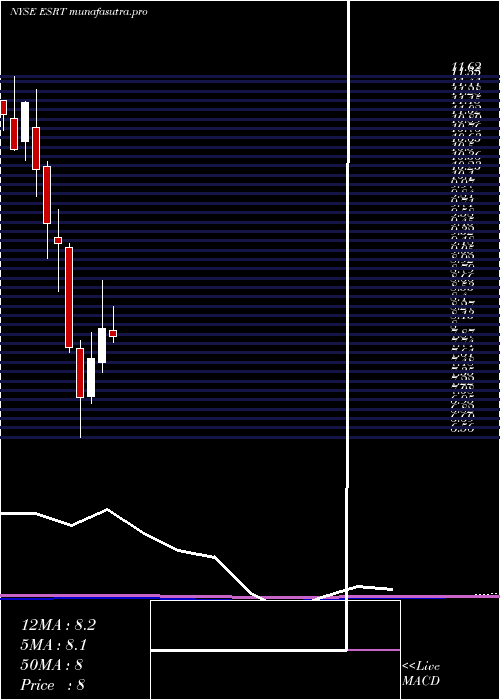
Monthly price and charts EmpireState Strong monthly Stock price targets for EmpireState ESRT are 6.79 and 7.57 | Monthly Target 1 | 6.63 | | Monthly Target 2 | 6.94 | | Monthly Target 3 | 7.41 | | Monthly Target 4 | 7.72 | | Monthly Target 5 | 8.19 |
Monthly price and volumes Empire State
| Date |
Closing |
Open |
Range |
Volume |
Mon 20 October 2025 |
7.25 (-5.35%) |
7.63 |
7.10 - 7.88 |
0.5579 times |
Tue 30 September 2025 |
7.66 (0.13%) |
7.60 |
7.33 - 8.07 |
1.0467 times |
Fri 29 August 2025 |
7.65 (5.66%) |
7.22 |
7.10 - 7.74 |
0.9319 times |
Thu 31 July 2025 |
7.24 (-10.51%) |
8.05 |
7.24 - 8.39 |
1.3646 times |
Mon 30 June 2025 |
8.09 (5.61%) |
7.61 |
7.47 - 8.76 |
1.508 times |
Fri 30 May 2025 |
7.66 (7.58%) |
7.13 |
7.03 - 8.03 |
0.9146 times |
Wed 30 April 2025 |
7.12 (-8.95%) |
7.81 |
6.56 - 7.91 |
1.1214 times |
Mon 31 March 2025 |
7.82 (-15.64%) |
9.22 |
7.75 - 9.28 |
0.9 times |
Fri 28 February 2025 |
9.27 (-3.03%) |
9.36 |
8.60 - 9.75 |
0.8433 times |
Fri 31 January 2025 |
9.56 (-7.36%) |
10.36 |
9.06 - 10.42 |
0.8115 times |
Tue 31 December 2024 |
10.32 (-8.27%) |
10.90 |
9.94 - 11.43 |
0.6106 times |
DMA SMA EMA moving averages of Empire State ESRT
DMA (daily moving average) of Empire State ESRT
| DMA period | DMA value | | 5 day DMA | 7.27 | | 12 day DMA | 7.5 | | 20 day DMA | 7.53 | | 35 day DMA | 7.62 | | 50 day DMA | 7.55 | | 100 day DMA | 7.74 | | 150 day DMA | 7.64 | | 200 day DMA | 8.05 | EMA (exponential moving average) of Empire State ESRT
| EMA period | EMA current | EMA prev | EMA prev2 | | 5 day EMA | 7.3 | 7.32 | 7.35 | | 12 day EMA | 7.42 | 7.45 | 7.48 | | 20 day EMA | 7.48 | 7.5 | 7.52 | | 35 day EMA | 7.51 | 7.53 | 7.55 | | 50 day EMA | 7.51 | 7.52 | 7.53 |
SMA (simple moving average) of Empire State ESRT
| SMA period | SMA current | SMA prev | SMA prev2 | | 5 day SMA | 7.27 | 7.26 | 7.36 | | 12 day SMA | 7.5 | 7.53 | 7.56 | | 20 day SMA | 7.53 | 7.54 | 7.57 | | 35 day SMA | 7.62 | 7.63 | 7.63 | | 50 day SMA | 7.55 | 7.56 | 7.56 | | 100 day SMA | 7.74 | 7.74 | 7.75 | | 150 day SMA | 7.64 | 7.65 | 7.65 | | 200 day SMA | 8.05 | 8.06 | 8.08 |
|
|
