EquityCommonwealth EQC full analysis,charts,indicators,moving averages,SMA,DMA,EMA,ADX,MACD,RSIEquity Commonwealth EQC WideScreen charts, DMA,SMA,EMA technical analysis, forecast prediction, by indicators ADX,MACD,RSI,CCI NYSE stock exchange
operates under Consumer Services sector & deals in Real Estate Investment Trusts
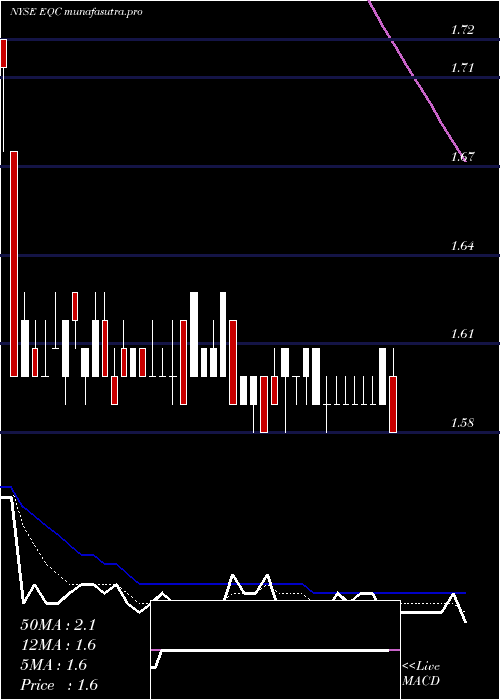
Daily price and charts and targets EquityCommonwealth Strong Daily Stock price targets for EquityCommonwealth EQC are 1.57 and 1.6 | Daily Target 1 | 1.56 | | Daily Target 2 | 1.57 | | Daily Target 3 | 1.59 | | Daily Target 4 | 1.6 | | Daily Target 5 | 1.62 |
Daily price and volume Equity Commonwealth
| Date |
Closing |
Open |
Range |
Volume |
Mon 21 April 2025 |
1.58 (-1.86%) |
1.60 |
1.58 - 1.61 |
6.8829 times |
Thu 17 April 2025 |
1.61 (1.26%) |
1.59 |
1.59 - 1.61 |
0.5609 times |
Wed 16 April 2025 |
1.59 (0%) |
1.59 |
1.59 - 1.60 |
0 times |
Wed 16 April 2025 |
1.59 (0%) |
1.59 |
1.59 - 1.60 |
0 times |
Wed 16 April 2025 |
1.59 (0%) |
1.59 |
1.59 - 1.60 |
0.0992 times |
Wed 16 April 2025 |
1.59 (0%) |
1.59 |
1.59 - 1.60 |
0 times |
Wed 16 April 2025 |
1.59 (0%) |
1.59 |
1.59 - 1.60 |
0 times |
Tue 15 April 2025 |
1.59 (-1.24%) |
1.59 |
1.58 - 1.60 |
1.5473 times |
Mon 14 April 2025 |
1.61 (0%) |
1.59 |
1.59 - 1.61 |
0.5358 times |
Fri 11 April 2025 |
1.61 (0.63%) |
1.60 |
1.59 - 1.61 |
0.3739 times |
Thu 10 April 2025 |
1.60 (-0.62%) |
1.60 |
1.59 - 1.60 |
0.475 times |
Weekly price and charts EquityCommonwealth Strong weekly Stock price targets for EquityCommonwealth EQC are 1.57 and 1.6 | Weekly Target 1 | 1.56 | | Weekly Target 2 | 1.57 | | Weekly Target 3 | 1.59 | | Weekly Target 4 | 1.6 | | Weekly Target 5 | 1.62 |
Weekly price and volumes for Equity Commonwealth
| Date |
Closing |
Open |
Range |
Volume |
Mon 21 April 2025 |
1.58 (-1.86%) |
1.60 |
1.58 - 1.61 |
2.746 times |
Thu 17 April 2025 |
1.61 (1.26%) |
1.59 |
1.59 - 1.61 |
0.2238 times |
Wed 16 April 2025 |
1.59 (0%) |
1.59 |
1.59 - 1.60 |
0 times |
Wed 16 April 2025 |
1.59 (0%) |
1.59 |
1.59 - 1.60 |
0.0396 times |
Wed 16 April 2025 |
1.59 (0%) |
1.59 |
1.59 - 1.60 |
0 times |
Wed 16 April 2025 |
1.59 (-1.24%) |
1.59 |
1.58 - 1.61 |
0.8311 times |
Fri 11 April 2025 |
1.61 (0.63%) |
1.60 |
1.58 - 1.61 |
3.7568 times |
Fri 04 April 2025 |
1.60 (-0.62%) |
1.60 |
1.58 - 1.63 |
0.8935 times |
Fri 28 March 2025 |
1.61 (0.63%) |
1.62 |
1.59 - 1.63 |
0.5603 times |
Fri 21 March 2025 |
1.60 (0%) |
1.60 |
1.59 - 1.62 |
0.9489 times |
Fri 14 March 2025 |
1.60 (-1.23%) |
1.60 |
1.59 - 1.63 |
0.6522 times |

Monthly price and charts EquityCommonwealth Strong monthly Stock price targets for EquityCommonwealth EQC are 1.56 and 1.61 | Monthly Target 1 | 1.55 | | Monthly Target 2 | 1.56 | | Monthly Target 3 | 1.5966666666667 | | Monthly Target 4 | 1.61 | | Monthly Target 5 | 1.65 |
Monthly price and volumes Equity Commonwealth
| Date |
Closing |
Open |
Range |
Volume |
Mon 21 April 2025 |
1.58 (-1.86%) |
1.60 |
1.58 - 1.63 |
1.1224 times |
Mon 31 March 2025 |
1.61 (-0.62%) |
1.61 |
1.59 - 1.63 |
0.4042 times |
Fri 28 February 2025 |
1.62 (-6.9%) |
1.72 |
1.60 - 1.79 |
0.5455 times |
Fri 31 January 2025 |
1.74 (-1.69%) |
1.80 |
1.66 - 1.89 |
0.6785 times |
Tue 31 December 2024 |
1.77 (-91.22%) |
20.22 |
1.40 - 20.31 |
2.446 times |
Tue 26 November 2024 |
20.17 (1.92%) |
19.79 |
19.68 - 20.24 |
2.062 times |
Thu 31 October 2024 |
19.79 (-0.55%) |
19.85 |
19.58 - 20.08 |
0.7869 times |
Mon 30 September 2024 |
19.90 (-1.83%) |
20.17 |
19.65 - 20.47 |
0.6376 times |
Fri 30 August 2024 |
20.27 (-0.49%) |
20.34 |
19.91 - 20.46 |
0.687 times |
Wed 31 July 2024 |
20.37 (5%) |
19.36 |
19.02 - 21.00 |
0.6301 times |
Fri 28 June 2024 |
19.40 (0.47%) |
19.34 |
18.87 - 19.62 |
0.4828 times |

DMA SMA EMA moving averages of Equity Commonwealth EQC
DMA (daily moving average) of Equity Commonwealth EQC
| DMA period | DMA value | | 5 day DMA | 1.59 | | 12 day DMA | 1.6 | | 20 day DMA | 1.6 | | 35 day DMA | 1.6 | | 50 day DMA | 1.63 | | 100 day DMA | 2.78 | | 150 day DMA | 8.49 | | 200 day DMA | 11.37 | EMA (exponential moving average) of Equity Commonwealth EQC
| EMA period | EMA current | EMA prev | EMA prev2 | | 5 day EMA | 1.59 | 1.6 | 1.6 | | 12 day EMA | 1.61 | 1.61 | 1.61 | | 20 day EMA | 1.63 | 1.63 | 1.63 | | 35 day EMA | 1.66 | 1.66 | 1.66 | | 50 day EMA | 1.64 | 1.64 | 1.64 |
SMA (simple moving average) of Equity Commonwealth EQC
| SMA period | SMA current | SMA prev | SMA prev2 | | 5 day SMA | 1.59 | 1.59 | 1.59 | | 12 day SMA | 1.6 | 1.6 | 1.6 | | 20 day SMA | 1.6 | 1.6 | 1.6 | | 35 day SMA | 1.6 | 1.6 | 1.6 | | 50 day SMA | 1.63 | 1.63 | 1.63 | | 100 day SMA | 2.78 | 2.97 | 3.15 | | 150 day SMA | 8.49 | 8.61 | 8.74 | | 200 day SMA | 11.37 | 11.45 | 11.54 |
|
|
