EprProperties EPR full analysis,charts,indicators,moving averages,SMA,DMA,EMA,ADX,MACD,RSIEpr Properties EPR WideScreen charts, DMA,SMA,EMA technical analysis, forecast prediction, by indicators ADX,MACD,RSI,CCI NYSE stock exchange
operates under Consumer Services sector & deals in Real Estate Investment Trusts
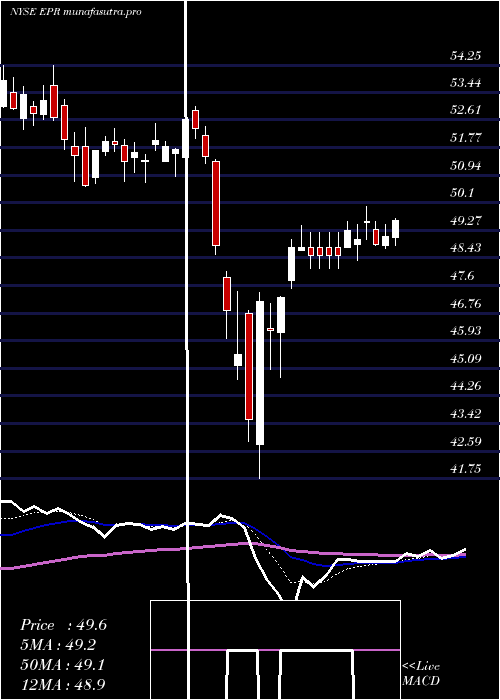
Daily price and charts and targets EprProperties Strong Daily Stock price targets for EprProperties EPR are 51.35 and 52.41 | Daily Target 1 | 51.16 | | Daily Target 2 | 51.53 | | Daily Target 3 | 52.216666666667 | | Daily Target 4 | 52.59 | | Daily Target 5 | 53.28 |
Daily price and volume Epr Properties
| Date |
Closing |
Open |
Range |
Volume |
Thu 04 December 2025 |
51.91 (-1.01%) |
52.31 |
51.84 - 52.90 |
0.9983 times |
Wed 03 December 2025 |
52.44 (0.15%) |
52.50 |
52.16 - 52.95 |
1.0848 times |
Tue 02 December 2025 |
52.36 (-0.89%) |
52.78 |
51.88 - 52.91 |
1.3341 times |
Mon 01 December 2025 |
52.83 (1.07%) |
51.95 |
51.76 - 52.94 |
1.4985 times |
Fri 28 November 2025 |
52.27 (-0.08%) |
52.28 |
51.95 - 52.44 |
0.6716 times |
Wed 26 November 2025 |
52.31 (0.36%) |
52.29 |
52.17 - 53.02 |
0.3698 times |
Tue 25 November 2025 |
52.12 (0.21%) |
52.34 |
52.11 - 53.09 |
1.058 times |
Mon 24 November 2025 |
52.01 (0.29%) |
51.71 |
51.56 - 52.18 |
0.9841 times |
Fri 21 November 2025 |
51.86 (1.19%) |
51.46 |
51.31 - 52.30 |
0.85 times |
Thu 20 November 2025 |
51.25 (0.2%) |
51.42 |
51.02 - 51.72 |
1.1509 times |
Wed 19 November 2025 |
51.15 (0.22%) |
51.03 |
50.78 - 51.51 |
0.9673 times |
Weekly price and charts EprProperties Strong weekly Stock price targets for EprProperties EPR are 51.24 and 52.43 | Weekly Target 1 | 51.02 | | Weekly Target 2 | 51.46 | | Weekly Target 3 | 52.206666666667 | | Weekly Target 4 | 52.65 | | Weekly Target 5 | 53.4 |
Weekly price and volumes for Epr Properties
| Date |
Closing |
Open |
Range |
Volume |
Thu 04 December 2025 |
51.91 (-0.69%) |
51.95 |
51.76 - 52.95 |
0.9186 times |
Fri 28 November 2025 |
52.27 (0.79%) |
51.71 |
51.56 - 53.09 |
0.5762 times |
Fri 21 November 2025 |
51.86 (1.13%) |
51.50 |
50.14 - 52.30 |
0.9189 times |
Fri 14 November 2025 |
51.28 (0.63%) |
50.94 |
50.63 - 51.45 |
0.9812 times |
Fri 07 November 2025 |
50.96 (3.96%) |
50.18 |
49.00 - 51.00 |
0.9649 times |
Fri 31 October 2025 |
49.02 (0%) |
48.87 |
48.33 - 49.34 |
0.5381 times |
Fri 31 October 2025 |
49.02 (-8.87%) |
53.90 |
48.29 - 53.90 |
2.0546 times |
Fri 24 October 2025 |
53.79 (-1.25%) |
54.79 |
53.77 - 55.48 |
1.2704 times |
Fri 17 October 2025 |
54.47 (-1.11%) |
53.85 |
53.78 - 55.70 |
1.2686 times |
Tue 07 October 2025 |
55.08 (-3.37%) |
57.50 |
54.88 - 57.57 |
0.5085 times |
Fri 03 October 2025 |
57.00 (-0.85%) |
57.75 |
56.95 - 58.57 |
0.9399 times |
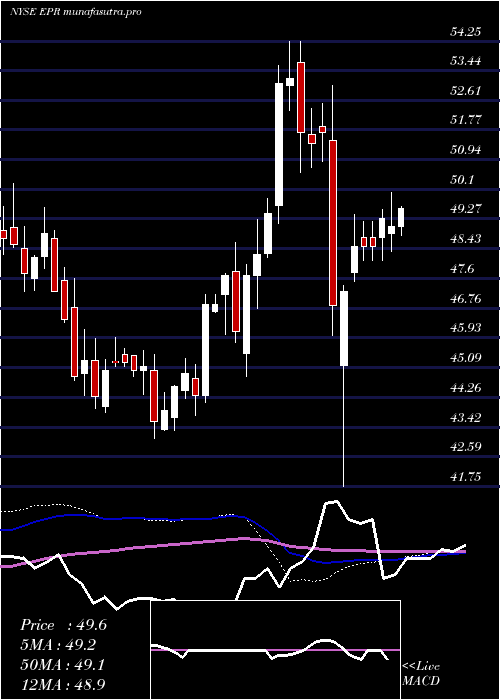
Monthly price and charts EprProperties Strong monthly Stock price targets for EprProperties EPR are 51.24 and 52.43 | Monthly Target 1 | 51.02 | | Monthly Target 2 | 51.46 | | Monthly Target 3 | 52.206666666667 | | Monthly Target 4 | 52.65 | | Monthly Target 5 | 53.4 |
Monthly price and volumes Epr Properties
| Date |
Closing |
Open |
Range |
Volume |
Thu 04 December 2025 |
51.91 (-0.69%) |
51.95 |
51.76 - 52.95 |
0.1841 times |
Fri 28 November 2025 |
52.27 (6.63%) |
50.18 |
49.00 - 53.09 |
0.6896 times |
Fri 31 October 2025 |
49.02 (-15.5%) |
57.95 |
48.29 - 58.57 |
1.2288 times |
Tue 30 September 2025 |
58.01 (6.93%) |
53.88 |
52.48 - 58.70 |
1.4648 times |
Fri 29 August 2025 |
54.25 (-1.44%) |
54.90 |
52.12 - 55.31 |
1.3396 times |
Thu 31 July 2025 |
55.04 (-5.53%) |
58.05 |
54.94 - 61.24 |
1.1085 times |
Mon 30 June 2025 |
58.26 (4.61%) |
55.47 |
54.94 - 59.31 |
0.9548 times |
Fri 30 May 2025 |
55.69 (12.53%) |
49.45 |
49.06 - 55.92 |
0.885 times |
Wed 30 April 2025 |
49.49 (-5.93%) |
52.90 |
41.75 - 53.00 |
1.1521 times |
Mon 31 March 2025 |
52.61 (-0.87%) |
53.00 |
50.58 - 54.25 |
0.9927 times |
Fri 28 February 2025 |
53.07 (15.12%) |
45.50 |
44.84 - 53.59 |
0.9169 times |

DMA SMA EMA moving averages of Epr Properties EPR
DMA (daily moving average) of Epr Properties EPR
| DMA period | DMA value | | 5 day DMA | 52.36 | | 12 day DMA | 51.96 | | 20 day DMA | 51.48 | | 35 day DMA | 51.87 | | 50 day DMA | 53.27 | | 100 day DMA | 54.46 | | 150 day DMA | 54.66 | | 200 day DMA | 53.54 | EMA (exponential moving average) of Epr Properties EPR
| EMA period | EMA current | EMA prev | EMA prev2 | | 5 day EMA | 52.22 | 52.37 | 52.33 | | 12 day EMA | 51.99 | 52.01 | 51.93 | | 20 day EMA | 51.95 | 51.95 | 51.9 | | 35 day EMA | 52.7 | 52.75 | 52.77 | | 50 day EMA | 53.49 | 53.55 | 53.6 |
SMA (simple moving average) of Epr Properties EPR
| SMA period | SMA current | SMA prev | SMA prev2 | | 5 day SMA | 52.36 | 52.44 | 52.38 | | 12 day SMA | 51.96 | 51.84 | 51.74 | | 20 day SMA | 51.48 | 51.37 | 51.22 | | 35 day SMA | 51.87 | 51.97 | 52.04 | | 50 day SMA | 53.27 | 53.37 | 53.45 | | 100 day SMA | 54.46 | 54.54 | 54.61 | | 150 day SMA | 54.66 | 54.64 | 54.62 | | 200 day SMA | 53.54 | 53.52 | 53.49 |
|
|
