EnterpriseProducts EPD full analysis,charts,indicators,moving averages,SMA,DMA,EMA,ADX,MACD,RSIEnterprise Products EPD WideScreen charts, DMA,SMA,EMA technical analysis, forecast prediction, by indicators ADX,MACD,RSI,CCI NYSE stock exchange
operates under Public Utilities sector & deals in Natural Gas Distribution
Daily price and charts and targets EnterpriseProducts Strong Daily Stock price targets for EnterpriseProducts EPD are 32.42 and 32.88 | Daily Target 1 | 32.04 | | Daily Target 2 | 32.33 | | Daily Target 3 | 32.503333333333 | | Daily Target 4 | 32.79 | | Daily Target 5 | 32.96 |
Daily price and volume Enterprise Products
| Date |
Closing |
Open |
Range |
Volume |
Thu 04 December 2025 |
32.61 (1.49%) |
32.28 |
32.22 - 32.68 |
0.7697 times |
Wed 03 December 2025 |
32.13 (0.41%) |
32.11 |
32.07 - 32.40 |
0.7726 times |
Tue 02 December 2025 |
32.00 (-1.63%) |
32.54 |
31.87 - 32.54 |
1.103 times |
Mon 01 December 2025 |
32.53 (-0.64%) |
32.57 |
32.48 - 32.74 |
1.2099 times |
Fri 28 November 2025 |
32.74 (0.65%) |
32.57 |
32.51 - 32.82 |
0.7731 times |
Wed 26 November 2025 |
32.53 (0.03%) |
32.52 |
32.44 - 32.79 |
0.7717 times |
Tue 25 November 2025 |
32.52 (-0.12%) |
32.50 |
32.40 - 32.77 |
1.246 times |
Mon 24 November 2025 |
32.56 (0.37%) |
32.44 |
32.27 - 32.95 |
1.2032 times |
Fri 21 November 2025 |
32.44 (1.72%) |
31.88 |
31.79 - 32.49 |
1.2329 times |
Thu 20 November 2025 |
31.89 (0.54%) |
31.80 |
31.71 - 32.19 |
0.918 times |
Wed 19 November 2025 |
31.72 (0.06%) |
31.45 |
31.35 - 31.98 |
0.7093 times |
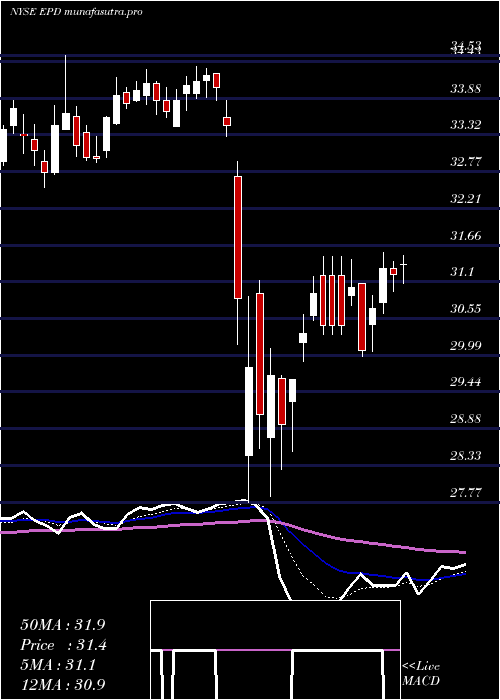
Weekly price and charts EnterpriseProducts Strong weekly Stock price targets for EnterpriseProducts EPD are 32.24 and 33.11 | Weekly Target 1 | 31.54 | | Weekly Target 2 | 32.07 | | Weekly Target 3 | 32.406666666667 | | Weekly Target 4 | 32.94 | | Weekly Target 5 | 33.28 |
Weekly price and volumes for Enterprise Products
| Date |
Closing |
Open |
Range |
Volume |
Thu 04 December 2025 |
32.61 (-0.4%) |
32.57 |
31.87 - 32.74 |
0.8109 times |
Fri 28 November 2025 |
32.74 (0.92%) |
32.44 |
32.27 - 32.95 |
0.84 times |
Fri 21 November 2025 |
32.44 (0.56%) |
32.25 |
31.35 - 32.49 |
1.0031 times |
Fri 14 November 2025 |
32.26 (3.2%) |
31.12 |
30.97 - 32.49 |
1.3489 times |
Fri 07 November 2025 |
31.26 (1.53%) |
30.45 |
30.02 - 31.29 |
1.0249 times |
Fri 31 October 2025 |
30.79 (0%) |
30.96 |
30.50 - 31.03 |
0.3601 times |
Fri 31 October 2025 |
30.79 (-0.65%) |
31.07 |
30.39 - 31.59 |
1.581 times |
Fri 24 October 2025 |
30.99 (2.65%) |
30.21 |
30.16 - 31.33 |
0.8574 times |
Fri 17 October 2025 |
30.19 (-1.95%) |
30.86 |
30.01 - 30.97 |
1.1855 times |
Fri 10 October 2025 |
30.79 (-2.75%) |
31.77 |
30.71 - 31.80 |
0.9881 times |
Fri 03 October 2025 |
31.66 (0.09%) |
31.50 |
30.99 - 31.78 |
1.1976 times |
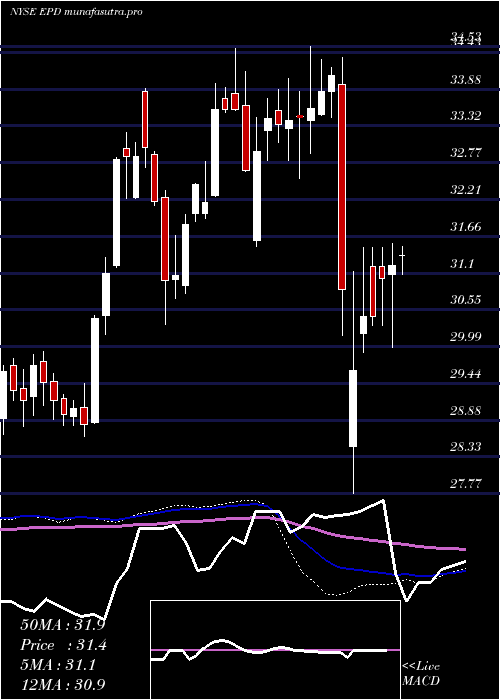
Monthly price and charts EnterpriseProducts Strong monthly Stock price targets for EnterpriseProducts EPD are 32.24 and 33.11 | Monthly Target 1 | 31.54 | | Monthly Target 2 | 32.07 | | Monthly Target 3 | 32.406666666667 | | Monthly Target 4 | 32.94 | | Monthly Target 5 | 33.28 |
Monthly price and volumes Enterprise Products
| Date |
Closing |
Open |
Range |
Volume |
Thu 04 December 2025 |
32.61 (-0.4%) |
32.57 |
31.87 - 32.74 |
0.1701 times |
Fri 28 November 2025 |
32.74 (6.33%) |
30.45 |
30.02 - 32.95 |
0.8847 times |
Fri 31 October 2025 |
30.79 (-1.54%) |
31.28 |
30.01 - 31.80 |
1.1738 times |
Tue 30 September 2025 |
31.27 (-2.71%) |
32.10 |
30.99 - 32.25 |
0.9842 times |
Fri 29 August 2025 |
32.14 (3.71%) |
30.82 |
30.62 - 32.23 |
1.0048 times |
Thu 31 July 2025 |
30.99 (-0.06%) |
31.11 |
30.72 - 32.12 |
1.0942 times |
Mon 30 June 2025 |
31.01 (0.62%) |
31.03 |
30.48 - 32.29 |
0.886 times |
Fri 30 May 2025 |
30.82 (3.08%) |
29.95 |
29.68 - 32.69 |
1.0574 times |
Wed 30 April 2025 |
29.90 (-12.42%) |
34.15 |
27.77 - 34.33 |
1.7302 times |
Mon 31 March 2025 |
34.14 (2.18%) |
33.47 |
32.53 - 34.53 |
1.0146 times |
Fri 28 February 2025 |
33.41 (2.33%) |
31.59 |
31.51 - 34.04 |
1.1483 times |

DMA SMA EMA moving averages of Enterprise Products EPD
DMA (daily moving average) of Enterprise Products EPD
| DMA period | DMA value | | 5 day DMA | 32.4 | | 12 day DMA | 32.28 | | 20 day DMA | 31.99 | | 35 day DMA | 31.49 | | 50 day DMA | 31.43 | | 100 day DMA | 31.49 | | 150 day DMA | 31.45 | | 200 day DMA | 31.67 | EMA (exponential moving average) of Enterprise Products EPD
| EMA period | EMA current | EMA prev | EMA prev2 | | 5 day EMA | 32.38 | 32.27 | 32.34 | | 12 day EMA | 32.24 | 32.17 | 32.18 | | 20 day EMA | 32.03 | 31.97 | 31.95 | | 35 day EMA | 31.8 | 31.75 | 31.73 | | 50 day EMA | 31.53 | 31.49 | 31.46 |
SMA (simple moving average) of Enterprise Products EPD
| SMA period | SMA current | SMA prev | SMA prev2 | | 5 day SMA | 32.4 | 32.39 | 32.46 | | 12 day SMA | 32.28 | 32.21 | 32.22 | | 20 day SMA | 31.99 | 31.89 | 31.79 | | 35 day SMA | 31.49 | 31.43 | 31.39 | | 50 day SMA | 31.43 | 31.41 | 31.39 | | 100 day SMA | 31.49 | 31.48 | 31.48 | | 150 day SMA | 31.45 | 31.43 | 31.42 | | 200 day SMA | 31.67 | 31.68 | 31.68 |
|
|
