EpamSystems EPAM full analysis,charts,indicators,moving averages,SMA,DMA,EMA,ADX,MACD,RSIEpam Systems EPAM WideScreen charts, DMA,SMA,EMA technical analysis, forecast prediction, by indicators ADX,MACD,RSI,CCI NYSE stock exchange
operates under Technology sector & deals in EDP Services
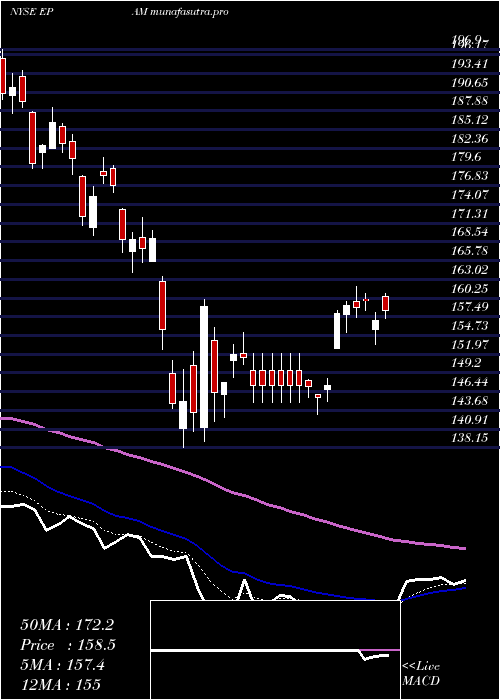
Daily price and charts and targets EpamSystems Strong Daily Stock price targets for EpamSystems EPAM are 201.97 and 205.98 | Daily Target 1 | 198.75 | | Daily Target 2 | 201.17 | | Daily Target 3 | 202.75666666667 | | Daily Target 4 | 205.18 | | Daily Target 5 | 206.77 |
Daily price and volume Epam Systems
| Date |
Closing |
Open |
Range |
Volume |
Fri 05 December 2025 |
203.60 (1.04%) |
200.54 |
200.33 - 204.34 |
1.2142 times |
Thu 04 December 2025 |
201.50 (0.75%) |
200.00 |
197.51 - 203.43 |
1.483 times |
Wed 03 December 2025 |
200.00 (3.76%) |
192.83 |
192.07 - 200.00 |
1.3534 times |
Tue 02 December 2025 |
192.75 (1.22%) |
191.55 |
188.90 - 193.05 |
0.3172 times |
Mon 01 December 2025 |
190.42 (1.83%) |
186.07 |
185.47 - 192.33 |
1.1646 times |
Fri 28 November 2025 |
187.00 (1.25%) |
184.72 |
184.09 - 187.87 |
0.376 times |
Wed 26 November 2025 |
184.69 (-0.6%) |
184.71 |
184.26 - 186.87 |
0.687 times |
Tue 25 November 2025 |
185.80 (1.4%) |
184.61 |
183.43 - 186.30 |
1.1598 times |
Mon 24 November 2025 |
183.23 (1.24%) |
181.99 |
179.00 - 187.17 |
0.988 times |
Fri 21 November 2025 |
180.98 (1.32%) |
179.91 |
178.96 - 185.32 |
1.2568 times |
Thu 20 November 2025 |
178.62 (-1.28%) |
182.28 |
176.25 - 183.67 |
1.3873 times |
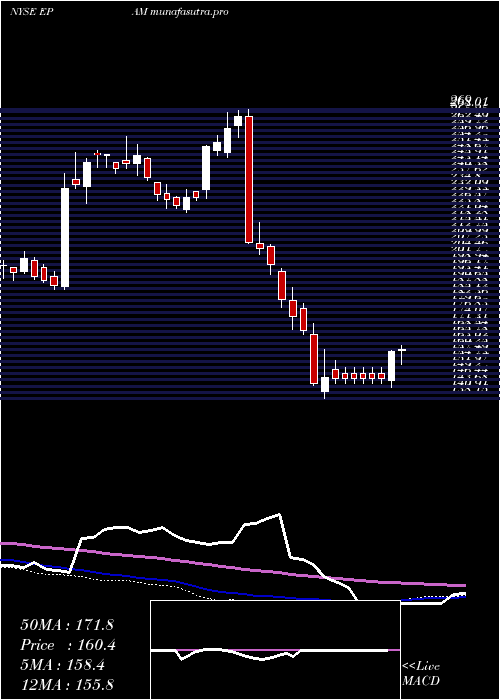
Weekly price and charts EpamSystems Strong weekly Stock price targets for EpamSystems EPAM are 194.54 and 213.41 | Weekly Target 1 | 178.93 | | Weekly Target 2 | 191.27 | | Weekly Target 3 | 197.80333333333 | | Weekly Target 4 | 210.14 | | Weekly Target 5 | 216.67 |
Weekly price and volumes for Epam Systems
| Date |
Closing |
Open |
Range |
Volume |
Fri 05 December 2025 |
203.60 (8.88%) |
186.07 |
185.47 - 204.34 |
1.1805 times |
Fri 28 November 2025 |
187.00 (3.33%) |
181.99 |
179.00 - 187.87 |
0.6851 times |
Fri 21 November 2025 |
180.98 (1.09%) |
177.80 |
171.41 - 185.32 |
1.7884 times |
Fri 14 November 2025 |
179.02 (2.12%) |
177.70 |
175.82 - 183.83 |
1.615 times |
Fri 07 November 2025 |
175.30 (7.19%) |
158.70 |
155.00 - 175.76 |
1.1511 times |
Fri 31 October 2025 |
163.54 (0%) |
160.25 |
159.72 - 163.63 |
0.26 times |
Fri 31 October 2025 |
163.54 (2.6%) |
161.29 |
158.98 - 165.27 |
1.1785 times |
Fri 24 October 2025 |
159.40 (10.3%) |
145.05 |
142.77 - 160.20 |
0.9997 times |
Fri 17 October 2025 |
144.52 (1.5%) |
143.65 |
140.00 - 148.73 |
0.5939 times |
Fri 10 October 2025 |
142.38 (-7.62%) |
153.62 |
142.38 - 154.73 |
0.5479 times |
Fri 03 October 2025 |
154.12 (1.5%) |
153.51 |
148.18 - 155.59 |
0.825 times |
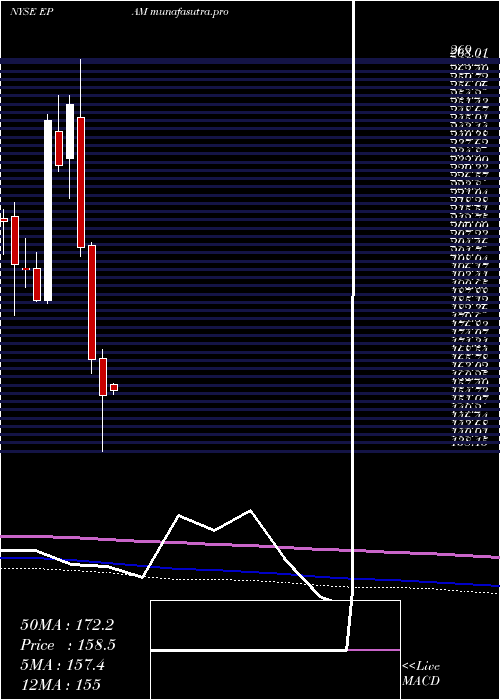
Monthly price and charts EpamSystems Strong monthly Stock price targets for EpamSystems EPAM are 194.54 and 213.41 | Monthly Target 1 | 178.93 | | Monthly Target 2 | 191.27 | | Monthly Target 3 | 197.80333333333 | | Monthly Target 4 | 210.14 | | Monthly Target 5 | 216.67 |
Monthly price and volumes Epam Systems
| Date |
Closing |
Open |
Range |
Volume |
Fri 05 December 2025 |
203.60 (8.88%) |
186.07 |
185.47 - 204.34 |
0.2893 times |
Fri 28 November 2025 |
187.00 (14.35%) |
158.70 |
155.00 - 187.87 |
1.2839 times |
Fri 31 October 2025 |
163.54 (8.46%) |
149.53 |
140.00 - 165.27 |
0.9798 times |
Tue 30 September 2025 |
150.79 (-14.5%) |
172.73 |
149.49 - 175.30 |
1.2252 times |
Fri 29 August 2025 |
176.36 (11.83%) |
155.27 |
146.43 - 177.65 |
1.1884 times |
Thu 31 July 2025 |
157.71 (-10.81%) |
176.63 |
157.27 - 185.82 |
0.7723 times |
Mon 30 June 2025 |
176.82 (1.34%) |
173.44 |
158.54 - 182.24 |
0.8634 times |
Fri 30 May 2025 |
174.49 (11.2%) |
160.54 |
156.21 - 189.62 |
1.4864 times |
Wed 30 April 2025 |
156.91 (-7.07%) |
169.20 |
138.15 - 172.21 |
0.9586 times |
Mon 31 March 2025 |
168.84 (-18.09%) |
207.00 |
164.00 - 207.82 |
0.9528 times |
Fri 28 February 2025 |
206.14 (-18.83%) |
249.61 |
203.28 - 269.00 |
1.0171 times |
DMA SMA EMA moving averages of Epam Systems EPAM
DMA (daily moving average) of Epam Systems EPAM
| DMA period | DMA value | | 5 day DMA | 197.65 | | 12 day DMA | 189.13 | | 20 day DMA | 185.17 | | 35 day DMA | 173.76 | | 50 day DMA | 166.46 | | 100 day DMA | 164.64 | | 150 day DMA | 168.1 | | 200 day DMA | 168.67 | EMA (exponential moving average) of Epam Systems EPAM
| EMA period | EMA current | EMA prev | EMA prev2 | | 5 day EMA | 198.14 | 195.41 | 192.37 | | 12 day EMA | 191.01 | 188.72 | 186.4 | | 20 day EMA | 185.23 | 183.3 | 181.39 | | 35 day EMA | 176.93 | 175.36 | 173.82 | | 50 day EMA | 168.65 | 167.22 | 165.82 |
SMA (simple moving average) of Epam Systems EPAM
| SMA period | SMA current | SMA prev | SMA prev2 | | 5 day SMA | 197.65 | 194.33 | 190.97 | | 12 day SMA | 189.13 | 187.05 | 185.08 | | 20 day SMA | 185.17 | 183.39 | 181.36 | | 35 day SMA | 173.76 | 172 | 170.33 | | 50 day SMA | 166.46 | 165.39 | 164.49 | | 100 day SMA | 164.64 | 164.27 | 163.89 | | 150 day SMA | 168.1 | 167.8 | 167.5 | | 200 day SMA | 168.67 | 168.7 | 168.82 |
|
|
