EogResources EOG full analysis,charts,indicators,moving averages,SMA,DMA,EMA,ADX,MACD,RSIEog Resources EOG WideScreen charts, DMA,SMA,EMA technical analysis, forecast prediction, by indicators ADX,MACD,RSI,CCI NYSE stock exchange
operates under Energy sector & deals in Oil Gas Production
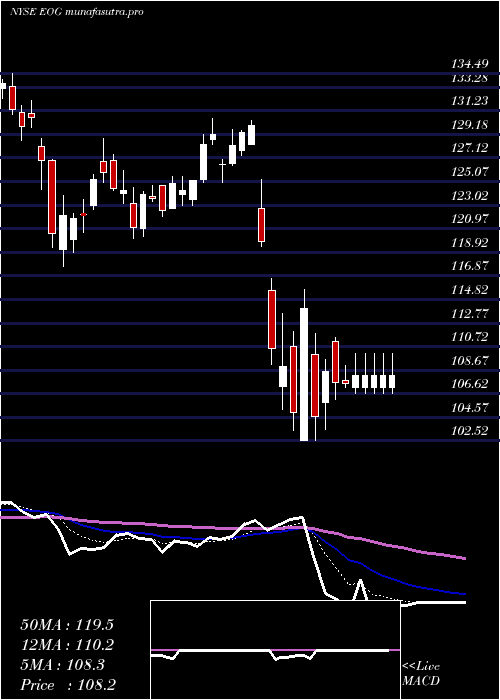
Daily price and charts and targets EogResources Strong Daily Stock price targets for EogResources EOG are 105.47 and 106.71 | Daily Target 1 | 105.16 | | Daily Target 2 | 105.78 | | Daily Target 3 | 106.4 | | Daily Target 4 | 107.02 | | Daily Target 5 | 107.64 |
Daily price and volume Eog Resources
| Date |
Closing |
Open |
Range |
Volume |
Mon 20 October 2025 |
106.40 (0.17%) |
106.48 |
105.78 - 107.02 |
0.8692 times |
Fri 17 October 2025 |
106.22 (-0.96%) |
106.55 |
104.96 - 107.00 |
1.5943 times |
Thu 16 October 2025 |
107.25 (-1.27%) |
108.83 |
105.20 - 109.39 |
1.0501 times |
Wed 15 October 2025 |
108.63 (-0.45%) |
109.48 |
107.94 - 110.11 |
0.661 times |
Tue 14 October 2025 |
109.12 (-0.55%) |
107.59 |
107.53 - 110.45 |
0.7416 times |
Mon 13 October 2025 |
109.72 (1.53%) |
109.67 |
108.12 - 109.98 |
1.0649 times |
Fri 10 October 2025 |
108.07 (-3.44%) |
110.89 |
108.04 - 111.71 |
1.0602 times |
Thu 09 October 2025 |
111.92 (1.29%) |
111.40 |
110.08 - 112.42 |
1.1028 times |
Wed 08 October 2025 |
110.50 (0.05%) |
110.37 |
109.34 - 110.71 |
1.0018 times |
Tue 07 October 2025 |
110.45 (-0.09%) |
110.35 |
108.87 - 110.58 |
0.854 times |
Mon 06 October 2025 |
110.55 (-0.25%) |
110.83 |
110.39 - 111.65 |
0.5593 times |
Weekly price and charts EogResources Strong weekly Stock price targets for EogResources EOG are 105.47 and 106.71 | Weekly Target 1 | 105.16 | | Weekly Target 2 | 105.78 | | Weekly Target 3 | 106.4 | | Weekly Target 4 | 107.02 | | Weekly Target 5 | 107.64 |
Weekly price and volumes for Eog Resources
| Date |
Closing |
Open |
Range |
Volume |
Mon 20 October 2025 |
106.40 (0.17%) |
106.48 |
105.78 - 107.02 |
0.2611 times |
Fri 17 October 2025 |
106.22 (-1.71%) |
109.67 |
104.96 - 110.45 |
1.5358 times |
Fri 10 October 2025 |
108.07 (-2.49%) |
110.83 |
108.04 - 112.42 |
1.3754 times |
Fri 03 October 2025 |
110.83 (-5.52%) |
116.16 |
110.18 - 116.56 |
1.7575 times |
Fri 26 September 2025 |
117.31 (1.13%) |
115.67 |
114.99 - 119.20 |
1.3378 times |
Fri 19 September 2025 |
116.00 (-1.83%) |
118.00 |
115.50 - 121.38 |
1.2564 times |
Fri 12 September 2025 |
118.16 (0.2%) |
117.85 |
116.06 - 121.02 |
0.8109 times |
Fri 05 September 2025 |
117.93 (-5.52%) |
124.48 |
117.04 - 126.11 |
0.7387 times |
Fri 29 August 2025 |
124.82 (0%) |
124.27 |
124.04 - 125.64 |
0.1249 times |
Fri 29 August 2025 |
124.82 (3.06%) |
120.60 |
119.70 - 125.64 |
0.8013 times |
Fri 22 August 2025 |
121.11 (1.78%) |
118.36 |
116.57 - 121.41 |
0.8473 times |

Monthly price and charts EogResources Strong monthly Stock price targets for EogResources EOG are 101.5 and 109.86 | Monthly Target 1 | 99.87 | | Monthly Target 2 | 103.13 | | Monthly Target 3 | 108.22666666667 | | Monthly Target 4 | 111.49 | | Monthly Target 5 | 116.59 |
Monthly price and volumes Eog Resources
| Date |
Closing |
Open |
Range |
Volume |
Mon 20 October 2025 |
106.40 (-5.1%) |
111.55 |
104.96 - 113.32 |
0.7953 times |
Tue 30 September 2025 |
112.12 (-10.17%) |
124.48 |
111.02 - 126.11 |
0.9969 times |
Fri 29 August 2025 |
124.82 (4%) |
119.46 |
113.36 - 125.64 |
0.7934 times |
Thu 31 July 2025 |
120.02 (0.34%) |
119.97 |
116.34 - 125.08 |
0.9247 times |
Mon 30 June 2025 |
119.61 (10.17%) |
111.11 |
109.70 - 127.81 |
1.1753 times |
Fri 30 May 2025 |
108.57 (-1.6%) |
109.54 |
107.02 - 117.77 |
1.1456 times |
Wed 30 April 2025 |
110.33 (-13.97%) |
127.76 |
102.52 - 130.41 |
1.3102 times |
Mon 31 March 2025 |
128.24 (1.02%) |
126.93 |
117.73 - 130.52 |
1.1559 times |
Fri 28 February 2025 |
126.94 (0.91%) |
126.30 |
124.36 - 135.87 |
0.7353 times |
Fri 31 January 2025 |
125.79 (2.62%) |
124.00 |
123.55 - 138.18 |
0.9674 times |
Tue 31 December 2024 |
122.58 (-7.51%) |
132.38 |
117.51 - 132.61 |
0.7752 times |

DMA SMA EMA moving averages of Eog Resources EOG
DMA (daily moving average) of Eog Resources EOG
| DMA period | DMA value | | 5 day DMA | 107.52 | | 12 day DMA | 109.14 | | 20 day DMA | 111.19 | | 35 day DMA | 114.61 | | 50 day DMA | 116.4 | | 100 day DMA | 117.56 | | 150 day DMA | 116.43 | | 200 day DMA | 119.68 | EMA (exponential moving average) of Eog Resources EOG
| EMA period | EMA current | EMA prev | EMA prev2 | | 5 day EMA | 107.37 | 107.85 | 108.66 | | 12 day EMA | 109.12 | 109.62 | 110.24 | | 20 day EMA | 110.82 | 111.29 | 111.82 | | 35 day EMA | 113.15 | 113.55 | 113.98 | | 50 day EMA | 115.53 | 115.9 | 116.3 |
SMA (simple moving average) of Eog Resources EOG
| SMA period | SMA current | SMA prev | SMA prev2 | | 5 day SMA | 107.52 | 108.19 | 108.56 | | 12 day SMA | 109.14 | 109.47 | 109.89 | | 20 day SMA | 111.19 | 111.64 | 112.13 | | 35 day SMA | 114.61 | 115.14 | 115.67 | | 50 day SMA | 116.4 | 116.61 | 116.81 | | 100 day SMA | 117.56 | 117.61 | 117.65 | | 150 day SMA | 116.43 | 116.54 | 116.66 | | 200 day SMA | 119.68 | 119.78 | 119.87 |
|
|
