EnovaInternational ENVA full analysis,charts,indicators,moving averages,SMA,DMA,EMA,ADX,MACD,RSIEnova International ENVA WideScreen charts, DMA,SMA,EMA technical analysis, forecast prediction, by indicators ADX,MACD,RSI,CCI NYSE stock exchange
operates under Finance sector & deals in Finance Consumer Services
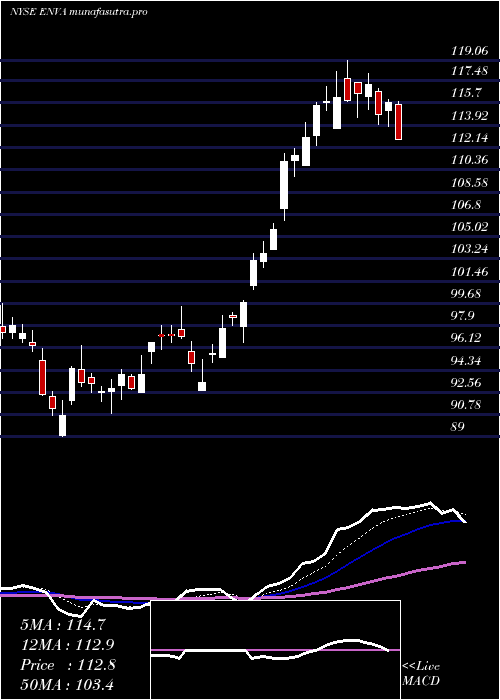
Daily price and charts and targets EnovaInternational Strong Daily Stock price targets for EnovaInternational ENVA are 110.42 and 112.73 | Daily Target 1 | 108.53 | | Daily Target 2 | 109.99 | | Daily Target 3 | 110.84333333333 | | Daily Target 4 | 112.3 | | Daily Target 5 | 113.15 |
Daily price and volume Enova International
| Date |
Closing |
Open |
Range |
Volume |
Tue 21 October 2025 |
111.44 (1.8%) |
109.39 |
109.39 - 111.70 |
0.53 times |
Mon 20 October 2025 |
109.47 (0.54%) |
109.70 |
108.72 - 111.09 |
0.8081 times |
Fri 17 October 2025 |
108.88 (1.69%) |
107.81 |
107.15 - 109.93 |
1.1132 times |
Thu 16 October 2025 |
107.07 (-4.15%) |
111.25 |
106.46 - 111.59 |
1.011 times |
Wed 15 October 2025 |
111.71 (1.12%) |
111.34 |
110.16 - 112.70 |
1.0586 times |
Tue 14 October 2025 |
110.47 (4.24%) |
103.22 |
103.02 - 110.98 |
1.0986 times |
Mon 13 October 2025 |
105.98 (1.89%) |
105.60 |
103.98 - 107.00 |
0.8847 times |
Fri 10 October 2025 |
104.01 (-3.69%) |
108.63 |
103.41 - 109.21 |
1.5245 times |
Thu 09 October 2025 |
108.00 (-0.19%) |
108.30 |
107.48 - 108.80 |
0.8767 times |
Wed 08 October 2025 |
108.21 (-0.32%) |
109.20 |
108.01 - 110.10 |
1.0946 times |
Tue 07 October 2025 |
108.56 (-1.77%) |
110.06 |
108.39 - 111.50 |
1.1913 times |
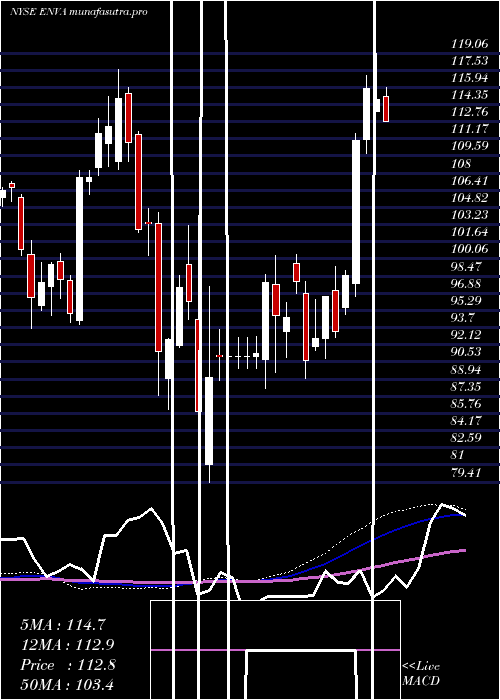
Weekly price and charts EnovaInternational Strong weekly Stock price targets for EnovaInternational ENVA are 110.08 and 113.06 | Weekly Target 1 | 107.64 | | Weekly Target 2 | 109.54 | | Weekly Target 3 | 110.62 | | Weekly Target 4 | 112.52 | | Weekly Target 5 | 113.6 |
Weekly price and volumes for Enova International
| Date |
Closing |
Open |
Range |
Volume |
Tue 21 October 2025 |
111.44 (2.35%) |
109.70 |
108.72 - 111.70 |
0.2382 times |
Fri 17 October 2025 |
108.88 (4.68%) |
105.60 |
103.02 - 112.70 |
0.9195 times |
Fri 10 October 2025 |
104.01 (-8.17%) |
114.00 |
103.41 - 114.60 |
0.9557 times |
Fri 03 October 2025 |
113.26 (-7.11%) |
122.45 |
109.58 - 123.58 |
1.1502 times |
Fri 26 September 2025 |
121.93 (-3.25%) |
125.24 |
120.29 - 130.34 |
0.9144 times |
Fri 19 September 2025 |
126.02 (9.45%) |
116.57 |
115.63 - 128.60 |
2.2623 times |
Fri 12 September 2025 |
115.14 (-4.19%) |
120.05 |
114.30 - 120.54 |
1.1907 times |
Fri 05 September 2025 |
120.17 (-0.93%) |
119.33 |
117.17 - 124.29 |
1.0243 times |
Fri 29 August 2025 |
121.30 (0%) |
122.04 |
120.80 - 122.43 |
0.2043 times |
Fri 29 August 2025 |
121.30 (6.42%) |
114.01 |
113.58 - 123.48 |
1.1404 times |
Fri 22 August 2025 |
113.98 (6.54%) |
106.80 |
105.25 - 114.31 |
0.8633 times |
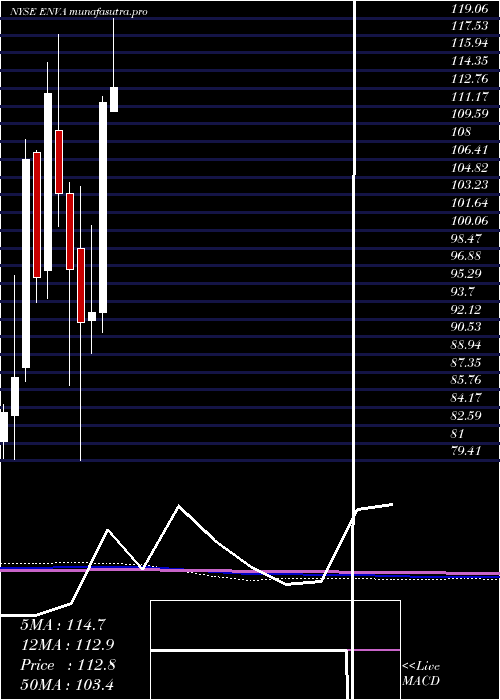
Monthly price and charts EnovaInternational Strong monthly Stock price targets for EnovaInternational ENVA are 101.09 and 113.38 | Monthly Target 1 | 97.63 | | Monthly Target 2 | 104.54 | | Monthly Target 3 | 109.92333333333 | | Monthly Target 4 | 116.83 | | Monthly Target 5 | 122.21 |
Monthly price and volumes Enova International
| Date |
Closing |
Open |
Range |
Volume |
Tue 21 October 2025 |
111.44 (-3.17%) |
113.88 |
103.02 - 115.31 |
0.5442 times |
Tue 30 September 2025 |
115.09 (-5.12%) |
119.33 |
113.49 - 130.34 |
1.2478 times |
Fri 29 August 2025 |
121.30 (16.01%) |
103.11 |
99.61 - 123.48 |
0.9951 times |
Thu 31 July 2025 |
104.56 (-6.24%) |
110.69 |
103.52 - 119.06 |
1.4627 times |
Mon 30 June 2025 |
111.52 (20.34%) |
92.67 |
90.87 - 112.09 |
1.0933 times |
Fri 30 May 2025 |
92.67 (0.96%) |
91.99 |
89.00 - 100.50 |
0.8307 times |
Wed 30 April 2025 |
91.79 (-4.94%) |
98.46 |
79.41 - 104.03 |
1.225 times |
Mon 31 March 2025 |
96.56 (-6.56%) |
103.35 |
86.12 - 104.37 |
0.905 times |
Fri 28 February 2025 |
103.34 (-8%) |
109.04 |
100.39 - 117.56 |
0.9202 times |
Fri 31 January 2025 |
112.32 (17.15%) |
96.43 |
93.99 - 115.07 |
0.7761 times |
Tue 31 December 2024 |
95.88 (-9.87%) |
107.01 |
93.60 - 107.25 |
0.7583 times |
DMA SMA EMA moving averages of Enova International ENVA
DMA (daily moving average) of Enova International ENVA
| DMA period | DMA value | | 5 day DMA | 109.71 | | 12 day DMA | 108.69 | | 20 day DMA | 112.49 | | 35 day DMA | 116.09 | | 50 day DMA | 115.46 | | 100 day DMA | 110.39 | | 150 day DMA | 105.03 | | 200 day DMA | 104.77 | EMA (exponential moving average) of Enova International ENVA
| EMA period | EMA current | EMA prev | EMA prev2 | | 5 day EMA | 109.8 | 108.98 | 108.73 | | 12 day EMA | 110.34 | 110.14 | 110.26 | | 20 day EMA | 111.77 | 111.81 | 112.06 | | 35 day EMA | 112.61 | 112.68 | 112.87 | | 50 day EMA | 114.01 | 114.12 | 114.31 |
SMA (simple moving average) of Enova International ENVA
| SMA period | SMA current | SMA prev | SMA prev2 | | 5 day SMA | 109.71 | 109.52 | 108.82 | | 12 day SMA | 108.69 | 108.85 | 109.25 | | 20 day SMA | 112.49 | 113.18 | 114.07 | | 35 day SMA | 116.09 | 116.35 | 116.68 | | 50 day SMA | 115.46 | 115.42 | 115.31 | | 100 day SMA | 110.39 | 110.21 | 110.06 | | 150 day SMA | 105.03 | 104.91 | 104.8 | | 200 day SMA | 104.77 | 104.71 | 104.66 |
|
|
