EastmanChemical EMN full analysis,charts,indicators,moving averages,SMA,DMA,EMA,ADX,MACD,RSIEastman Chemical EMN WideScreen charts, DMA,SMA,EMA technical analysis, forecast prediction, by indicators ADX,MACD,RSI,CCI NYSE stock exchange
operates under Basic Industries sector & deals in Major Chemicals
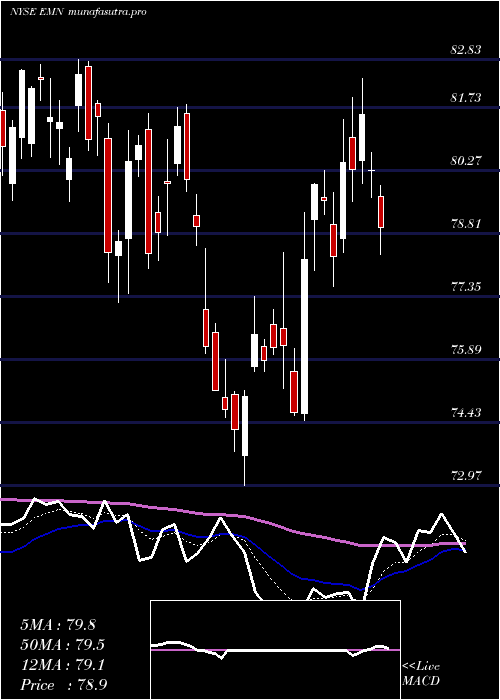
Daily price and charts and targets EastmanChemical Strong Daily Stock price targets for EastmanChemical EMN are 60.84 and 62.02 | Daily Target 1 | 60.61 | | Daily Target 2 | 61.07 | | Daily Target 3 | 61.786666666667 | | Daily Target 4 | 62.25 | | Daily Target 5 | 62.97 |
Daily price and volume Eastman Chemical
| Date |
Closing |
Open |
Range |
Volume |
Mon 20 October 2025 |
61.54 (0.42%) |
61.58 |
61.32 - 62.50 |
1.0599 times |
Fri 17 October 2025 |
61.28 (1.86%) |
60.31 |
60.23 - 61.43 |
0.9631 times |
Thu 16 October 2025 |
60.16 (-0.84%) |
61.18 |
59.46 - 61.42 |
1.1108 times |
Wed 15 October 2025 |
60.67 (0.21%) |
60.92 |
60.17 - 61.48 |
0.6893 times |
Tue 14 October 2025 |
60.54 (0.8%) |
58.85 |
58.35 - 60.96 |
1.1412 times |
Mon 13 October 2025 |
60.06 (3.2%) |
59.74 |
59.00 - 60.51 |
1.1854 times |
Fri 10 October 2025 |
58.20 (-4.65%) |
61.42 |
57.94 - 61.47 |
1.3436 times |
Thu 09 October 2025 |
61.04 (-2.09%) |
62.78 |
60.83 - 62.85 |
0.6922 times |
Wed 08 October 2025 |
62.34 (-0.02%) |
62.56 |
61.77 - 62.78 |
0.7646 times |
Tue 07 October 2025 |
62.35 (-3.68%) |
63.89 |
61.90 - 64.22 |
1.05 times |
Mon 06 October 2025 |
64.73 (1.09%) |
64.16 |
63.43 - 64.73 |
0.6978 times |
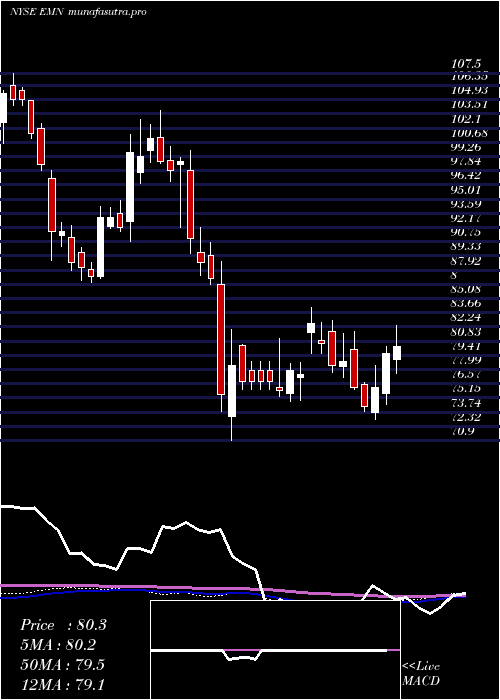
Weekly price and charts EastmanChemical Strong weekly Stock price targets for EastmanChemical EMN are 60.84 and 62.02 | Weekly Target 1 | 60.61 | | Weekly Target 2 | 61.07 | | Weekly Target 3 | 61.786666666667 | | Weekly Target 4 | 62.25 | | Weekly Target 5 | 62.97 |
Weekly price and volumes for Eastman Chemical
| Date |
Closing |
Open |
Range |
Volume |
Mon 20 October 2025 |
61.54 (0.42%) |
61.58 |
61.32 - 62.50 |
0.232 times |
Fri 17 October 2025 |
61.28 (5.29%) |
59.74 |
58.35 - 61.48 |
1.114 times |
Fri 10 October 2025 |
58.20 (-9.11%) |
64.16 |
57.94 - 64.73 |
0.9955 times |
Fri 03 October 2025 |
64.03 (2.1%) |
63.23 |
61.48 - 64.94 |
1.2681 times |
Fri 26 September 2025 |
62.71 (-3.69%) |
64.80 |
61.26 - 65.72 |
1.1887 times |
Fri 19 September 2025 |
65.11 (-3.05%) |
66.73 |
64.80 - 68.40 |
1.3975 times |
Fri 12 September 2025 |
67.16 (-2.75%) |
69.19 |
64.51 - 69.19 |
1.6319 times |
Fri 05 September 2025 |
69.06 (-1.82%) |
69.26 |
66.66 - 70.40 |
0.7717 times |
Fri 29 August 2025 |
70.34 (0%) |
70.43 |
69.48 - 70.63 |
0.3032 times |
Fri 29 August 2025 |
70.34 (1.3%) |
69.05 |
67.39 - 70.63 |
1.0973 times |
Fri 22 August 2025 |
69.44 (5.92%) |
65.41 |
65.26 - 69.82 |
0.9571 times |
Monthly price and charts EastmanChemical Strong monthly Stock price targets for EastmanChemical EMN are 56.24 and 63.24 | Monthly Target 1 | 54.47 | | Monthly Target 2 | 58.01 | | Monthly Target 3 | 61.473333333333 | | Monthly Target 4 | 65.01 | | Monthly Target 5 | 68.47 |
Monthly price and volumes Eastman Chemical
| Date |
Closing |
Open |
Range |
Volume |
Mon 20 October 2025 |
61.54 (-2.39%) |
62.16 |
57.94 - 64.94 |
0.6143 times |
Tue 30 September 2025 |
63.05 (-10.36%) |
69.26 |
61.26 - 70.40 |
1.0781 times |
Fri 29 August 2025 |
70.34 (-3.13%) |
63.77 |
56.78 - 70.63 |
1.2337 times |
Thu 31 July 2025 |
72.61 (-2.75%) |
74.63 |
72.07 - 82.38 |
1.0955 times |
Mon 30 June 2025 |
74.66 (-4.73%) |
78.30 |
72.97 - 81.79 |
1.322 times |
Fri 30 May 2025 |
78.37 (1.78%) |
77.10 |
74.86 - 84.18 |
1.2876 times |
Wed 30 April 2025 |
77.00 (-12.61%) |
87.99 |
70.90 - 88.73 |
1.1908 times |
Mon 31 March 2025 |
88.11 (-9.95%) |
98.51 |
85.84 - 99.89 |
0.7099 times |
Fri 28 February 2025 |
97.85 (-1.81%) |
97.65 |
96.54 - 103.82 |
0.6483 times |
Fri 31 January 2025 |
99.65 (9.12%) |
91.13 |
86.70 - 101.44 |
0.8198 times |
Tue 31 December 2024 |
91.32 (-13%) |
104.88 |
88.88 - 104.88 |
0.662 times |
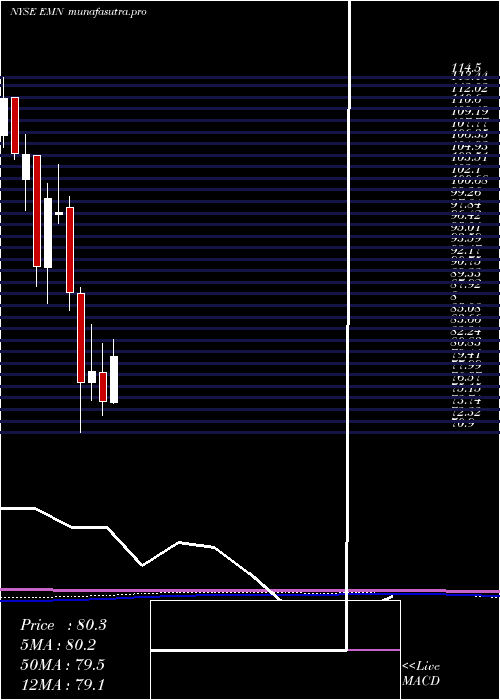
DMA SMA EMA moving averages of Eastman Chemical EMN
DMA (daily moving average) of Eastman Chemical EMN
| DMA period | DMA value | | 5 day DMA | 60.84 | | 12 day DMA | 61.41 | | 20 day DMA | 62.06 | | 35 day DMA | 64.16 | | 50 day DMA | 65.13 | | 100 day DMA | 70.53 | | 150 day DMA | 73.96 | | 200 day DMA | 79.33 | EMA (exponential moving average) of Eastman Chemical EMN
| EMA period | EMA current | EMA prev | EMA prev2 | | 5 day EMA | 61.01 | 60.75 | 60.48 | | 12 day EMA | 61.4 | 61.38 | 61.4 | | 20 day EMA | 62.14 | 62.2 | 62.3 | | 35 day EMA | 63.18 | 63.28 | 63.4 | | 50 day EMA | 64.39 | 64.51 | 64.64 |
SMA (simple moving average) of Eastman Chemical EMN
| SMA period | SMA current | SMA prev | SMA prev2 | | 5 day SMA | 60.84 | 60.54 | 59.93 | | 12 day SMA | 61.41 | 61.65 | 61.7 | | 20 day SMA | 62.06 | 62.2 | 62.39 | | 35 day SMA | 64.16 | 64.41 | 64.67 | | 50 day SMA | 65.13 | 65.12 | 65.12 | | 100 day SMA | 70.53 | 70.74 | 70.93 | | 150 day SMA | 73.96 | 74.15 | 74.35 | | 200 day SMA | 79.33 | 79.47 | 79.62 |
|
|
