TempletonEmerging EMF full analysis,charts,indicators,moving averages,SMA,DMA,EMA,ADX,MACD,RSITempleton Emerging EMF WideScreen charts, DMA,SMA,EMA technical analysis, forecast prediction, by indicators ADX,MACD,RSI,CCI NYSE stock exchange
operates under N A sector & deals in N A
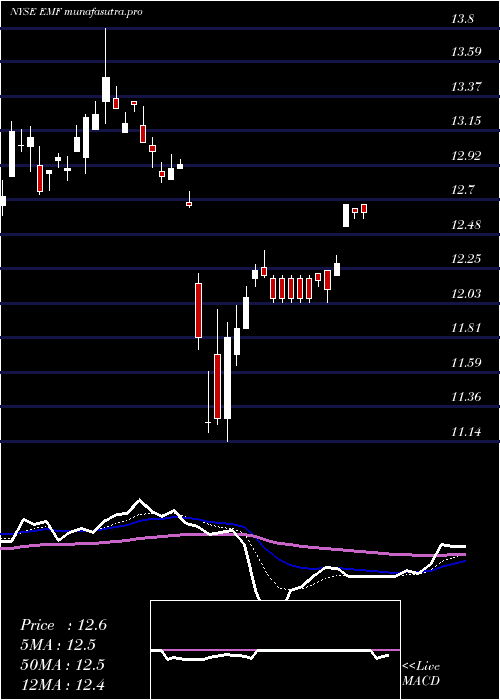
Daily price and charts and targets TempletonEmerging Strong Daily Stock price targets for TempletonEmerging EMF are 16.75 and 17.02 | Daily Target 1 | 16.68 | | Daily Target 2 | 16.81 | | Daily Target 3 | 16.953333333333 | | Daily Target 4 | 17.08 | | Daily Target 5 | 17.22 |
Daily price and volume Templeton Emerging
| Date |
Closing |
Open |
Range |
Volume |
Tue 21 October 2025 |
16.93 (-0.41%) |
17.01 |
16.83 - 17.10 |
0.393 times |
Mon 20 October 2025 |
17.00 (1.19%) |
16.86 |
16.86 - 17.00 |
0.393 times |
Fri 17 October 2025 |
16.80 (0.12%) |
16.76 |
16.69 - 16.80 |
0.4095 times |
Thu 16 October 2025 |
16.78 (1.57%) |
16.77 |
16.42 - 16.95 |
5.3733 times |
Wed 15 October 2025 |
16.52 (1.35%) |
16.43 |
16.43 - 16.70 |
0.3567 times |
Tue 14 October 2025 |
16.30 (-0.49%) |
16.23 |
16.07 - 16.39 |
0.7233 times |
Mon 13 October 2025 |
16.38 (-3.99%) |
16.82 |
16.38 - 17.05 |
0.8256 times |
Tue 07 October 2025 |
17.06 (0%) |
17.06 |
16.96 - 17.07 |
0.4492 times |
Mon 06 October 2025 |
17.06 (1.13%) |
16.92 |
16.84 - 17.29 |
0.6405 times |
Fri 03 October 2025 |
16.87 (-0.18%) |
16.91 |
16.71 - 17.00 |
0.4359 times |
Thu 02 October 2025 |
16.90 (0.96%) |
16.93 |
16.60 - 16.95 |
0.4263 times |
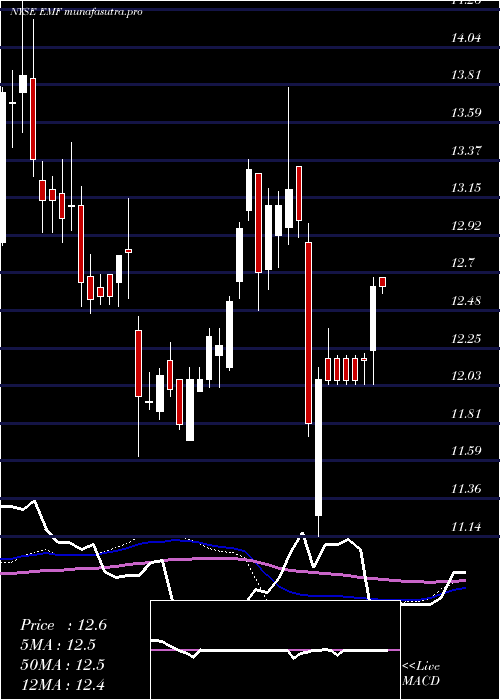
Weekly price and charts TempletonEmerging Strong weekly Stock price targets for TempletonEmerging EMF are 16.88 and 17.15 | Weekly Target 1 | 16.68 | | Weekly Target 2 | 16.81 | | Weekly Target 3 | 16.953333333333 | | Weekly Target 4 | 17.08 | | Weekly Target 5 | 17.22 |
Weekly price and volumes for Templeton Emerging
| Date |
Closing |
Open |
Range |
Volume |
Tue 21 October 2025 |
16.93 (0.77%) |
16.86 |
16.83 - 17.10 |
0.3475 times |
Fri 17 October 2025 |
16.80 (-1.52%) |
16.82 |
16.07 - 17.05 |
3.3995 times |
Tue 07 October 2025 |
17.06 (1.13%) |
16.92 |
16.84 - 17.29 |
0.4818 times |
Fri 03 October 2025 |
16.87 (3.69%) |
16.39 |
16.24 - 17.00 |
1.529 times |
Fri 26 September 2025 |
16.27 (-1.27%) |
16.48 |
16.12 - 16.60 |
0.5973 times |
Fri 19 September 2025 |
16.48 (2.42%) |
16.09 |
16.09 - 16.77 |
1.5596 times |
Fri 12 September 2025 |
16.09 (4.82%) |
15.39 |
15.39 - 16.10 |
0.5272 times |
Fri 05 September 2025 |
15.35 (0.52%) |
15.49 |
15.08 - 15.69 |
0.6922 times |
Fri 29 August 2025 |
15.27 (0%) |
15.31 |
15.21 - 15.31 |
0.0496 times |
Fri 29 August 2025 |
15.27 (-1.74%) |
15.55 |
15.21 - 15.66 |
0.8163 times |
Fri 22 August 2025 |
15.54 (0.78%) |
15.44 |
15.26 - 15.61 |
0.6352 times |
Monthly price and charts TempletonEmerging Strong monthly Stock price targets for TempletonEmerging EMF are 16.5 and 17.72 | Monthly Target 1 | 15.54 | | Monthly Target 2 | 16.24 | | Monthly Target 3 | 16.763333333333 | | Monthly Target 4 | 17.46 | | Monthly Target 5 | 17.98 |
Monthly price and volumes Templeton Emerging
| Date |
Closing |
Open |
Range |
Volume |
Tue 21 October 2025 |
16.93 (1.14%) |
16.74 |
16.07 - 17.29 |
0.5651 times |
Tue 30 September 2025 |
16.74 (9.63%) |
15.49 |
15.08 - 16.98 |
0.5132 times |
Fri 29 August 2025 |
15.27 (2%) |
14.90 |
14.83 - 15.66 |
0.411 times |
Thu 31 July 2025 |
14.97 (2.6%) |
14.57 |
14.36 - 15.13 |
1.1064 times |
Mon 30 June 2025 |
14.59 (8.07%) |
13.45 |
13.44 - 14.61 |
0.4035 times |
Fri 30 May 2025 |
13.50 (6.47%) |
12.72 |
12.68 - 13.69 |
0.5983 times |
Wed 30 April 2025 |
12.68 (-1.32%) |
12.83 |
11.14 - 12.99 |
0.9525 times |
Mon 31 March 2025 |
12.85 (1.18%) |
12.72 |
12.60 - 13.80 |
2.6841 times |
Fri 28 February 2025 |
12.70 (3.5%) |
12.14 |
12.12 - 13.37 |
0.9129 times |
Fri 31 January 2025 |
12.27 (2.68%) |
11.95 |
11.71 - 12.37 |
1.8529 times |
Tue 31 December 2024 |
11.95 (-4.86%) |
12.64 |
11.61 - 13.14 |
2.075 times |

DMA SMA EMA moving averages of Templeton Emerging EMF
DMA (daily moving average) of Templeton Emerging EMF
| DMA period | DMA value | | 5 day DMA | 16.81 | | 12 day DMA | 16.78 | | 20 day DMA | 16.67 | | 35 day DMA | 16.29 | | 50 day DMA | 16.02 | | 100 day DMA | 15.23 | | 150 day DMA | 14.4 | | 200 day DMA | 13.93 | EMA (exponential moving average) of Templeton Emerging EMF
| EMA period | EMA current | EMA prev | EMA prev2 | | 5 day EMA | 16.84 | 16.79 | 16.69 | | 12 day EMA | 16.74 | 16.71 | 16.66 | | 20 day EMA | 16.6 | 16.57 | 16.53 | | 35 day EMA | 16.31 | 16.27 | 16.23 | | 50 day EMA | 16.02 | 15.98 | 15.94 |
SMA (simple moving average) of Templeton Emerging EMF
| SMA period | SMA current | SMA prev | SMA prev2 | | 5 day SMA | 16.81 | 16.68 | 16.56 | | 12 day SMA | 16.78 | 16.76 | 16.74 | | 20 day SMA | 16.67 | 16.65 | 16.64 | | 35 day SMA | 16.29 | 16.24 | 16.2 | | 50 day SMA | 16.02 | 15.98 | 15.94 | | 100 day SMA | 15.23 | 15.19 | 15.16 | | 150 day SMA | 14.4 | 14.37 | 14.35 | | 200 day SMA | 13.93 | 13.9 | 13.88 |
|
|
