EsteeLauder EL full analysis,charts,indicators,moving averages,SMA,DMA,EMA,ADX,MACD,RSIEstee Lauder EL WideScreen charts, DMA,SMA,EMA technical analysis, forecast prediction, by indicators ADX,MACD,RSI,CCI NYSE stock exchange
operates under Consumer Non Durables sector & deals in Package Goods Cosmetics
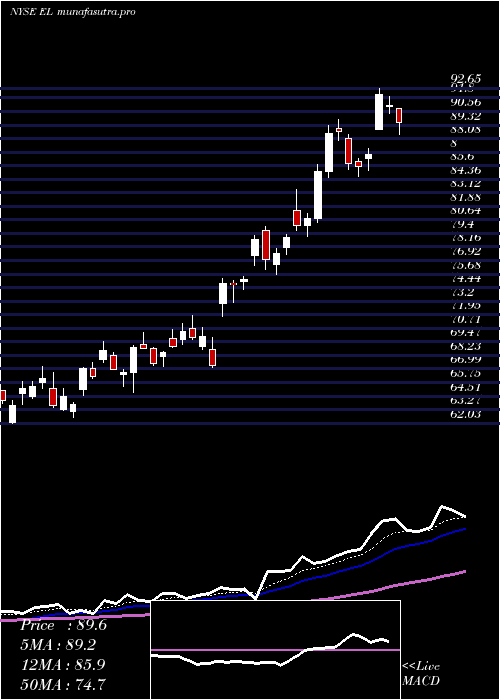
Daily price and charts and targets EsteeLauder Strong Daily Stock price targets for EsteeLauder EL are 104.11 and 106.79 | Daily Target 1 | 101.98 | | Daily Target 2 | 103.56 | | Daily Target 3 | 104.66333333333 | | Daily Target 4 | 106.24 | | Daily Target 5 | 107.34 |
Daily price and volume Estee Lauder
| Date |
Closing |
Open |
Range |
Volume |
Fri 05 December 2025 |
105.13 (1.26%) |
103.63 |
103.09 - 105.77 |
1.1877 times |
Thu 04 December 2025 |
103.82 (1.75%) |
102.26 |
101.52 - 104.02 |
1.5417 times |
Wed 03 December 2025 |
102.03 (2.39%) |
100.27 |
100.00 - 102.10 |
1.3269 times |
Tue 02 December 2025 |
99.65 (5.22%) |
95.48 |
95.20 - 99.90 |
0.8471 times |
Mon 01 December 2025 |
94.71 (0.68%) |
93.44 |
93.01 - 96.06 |
0.9659 times |
Fri 28 November 2025 |
94.07 (0.39%) |
93.78 |
93.62 - 94.34 |
0.3159 times |
Wed 26 November 2025 |
93.70 (1.91%) |
92.24 |
91.50 - 94.99 |
0.8238 times |
Tue 25 November 2025 |
91.94 (-1.55%) |
91.72 |
90.80 - 93.61 |
0.9111 times |
Mon 24 November 2025 |
93.39 (3.88%) |
90.00 |
89.66 - 93.92 |
1.1649 times |
Fri 21 November 2025 |
89.90 (3.8%) |
87.28 |
86.60 - 89.94 |
0.9151 times |
Thu 20 November 2025 |
86.61 (0.81%) |
87.26 |
86.00 - 89.32 |
0.9099 times |
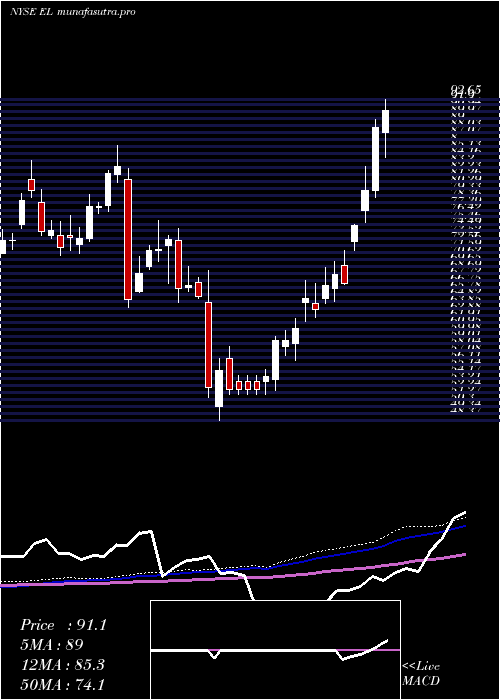
Weekly price and charts EsteeLauder Strong weekly Stock price targets for EsteeLauder EL are 99.07 and 111.83 | Weekly Target 1 | 88.54 | | Weekly Target 2 | 96.84 | | Weekly Target 3 | 101.30333333333 | | Weekly Target 4 | 109.6 | | Weekly Target 5 | 114.06 |
Weekly price and volumes for Estee Lauder
| Date |
Closing |
Open |
Range |
Volume |
Fri 05 December 2025 |
105.13 (11.76%) |
93.44 |
93.01 - 105.77 |
1.2314 times |
Fri 28 November 2025 |
94.07 (4.64%) |
90.00 |
89.66 - 94.99 |
0.6746 times |
Fri 21 November 2025 |
89.90 (1.95%) |
87.93 |
85.19 - 89.94 |
1.058 times |
Fri 14 November 2025 |
88.18 (0.49%) |
88.11 |
88.05 - 93.40 |
1.0268 times |
Fri 07 November 2025 |
87.75 (-9.25%) |
92.40 |
84.61 - 92.95 |
1.4449 times |
Fri 31 October 2025 |
96.69 (0%) |
97.13 |
94.62 - 98.00 |
0.2509 times |
Fri 31 October 2025 |
96.69 (-5.35%) |
102.64 |
92.39 - 103.52 |
1.23 times |
Fri 24 October 2025 |
102.16 (1.68%) |
101.80 |
97.53 - 104.53 |
0.9852 times |
Fri 17 October 2025 |
100.47 (14.63%) |
92.50 |
91.10 - 100.98 |
1.1338 times |
Fri 10 October 2025 |
87.65 (-0.43%) |
88.20 |
85.24 - 96.50 |
0.9643 times |
Fri 03 October 2025 |
88.03 (1.58%) |
87.77 |
85.01 - 89.90 |
0.9709 times |
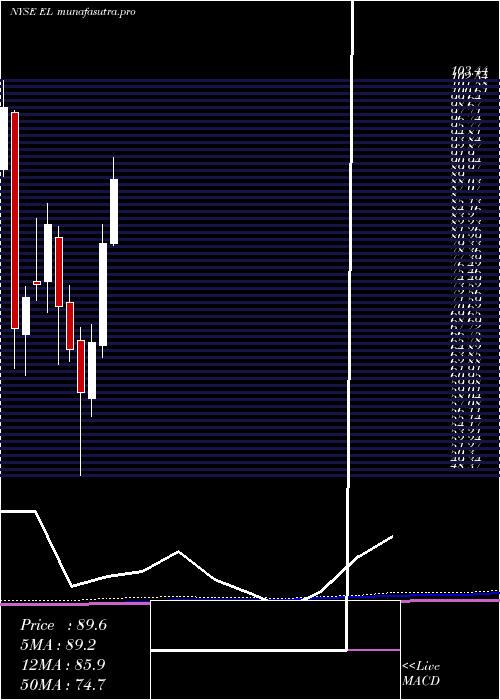
Monthly price and charts EsteeLauder Strong monthly Stock price targets for EsteeLauder EL are 99.07 and 111.83 | Monthly Target 1 | 88.54 | | Monthly Target 2 | 96.84 | | Monthly Target 3 | 101.30333333333 | | Monthly Target 4 | 109.6 | | Monthly Target 5 | 114.06 |
Monthly price and volumes Estee Lauder
| Date |
Closing |
Open |
Range |
Volume |
Fri 05 December 2025 |
105.13 (11.76%) |
93.44 |
93.01 - 105.77 |
0.2591 times |
Fri 28 November 2025 |
94.07 (-2.71%) |
92.40 |
84.61 - 94.99 |
0.8846 times |
Fri 31 October 2025 |
96.69 (9.73%) |
88.17 |
85.01 - 104.53 |
1.0419 times |
Tue 30 September 2025 |
88.12 (-3.94%) |
90.14 |
83.12 - 92.21 |
0.8878 times |
Fri 29 August 2025 |
91.73 (-1.72%) |
90.60 |
84.42 - 95.47 |
1.1653 times |
Thu 31 July 2025 |
93.34 (15.52%) |
80.75 |
80.40 - 95.30 |
1.2135 times |
Mon 30 June 2025 |
80.80 (20.71%) |
66.51 |
64.83 - 83.43 |
1.1836 times |
Fri 30 May 2025 |
66.94 (11.64%) |
59.15 |
56.66 - 69.49 |
1.1087 times |
Wed 30 April 2025 |
59.96 (-9.15%) |
67.21 |
48.37 - 68.98 |
1.4214 times |
Mon 31 March 2025 |
66.00 (-8.22%) |
72.53 |
64.24 - 74.84 |
0.834 times |
Fri 28 February 2025 |
71.91 (-13.81%) |
81.61 |
63.92 - 83.06 |
1.4144 times |
DMA SMA EMA moving averages of Estee Lauder EL
DMA (daily moving average) of Estee Lauder EL
| DMA period | DMA value | | 5 day DMA | 101.07 | | 12 day DMA | 95.07 | | 20 day DMA | 92.67 | | 35 day DMA | 94.7 | | 50 day DMA | 93.58 | | 100 day DMA | 91.48 | | 150 day DMA | 85.14 | | 200 day DMA | 79.59 | EMA (exponential moving average) of Estee Lauder EL
| EMA period | EMA current | EMA prev | EMA prev2 | | 5 day EMA | 101.48 | 99.65 | 97.57 | | 12 day EMA | 97.27 | 95.84 | 94.39 | | 20 day EMA | 95.39 | 94.36 | 93.37 | | 35 day EMA | 93.88 | 93.22 | 92.6 | | 50 day EMA | 93.76 | 93.3 | 92.87 |
SMA (simple moving average) of Estee Lauder EL
| SMA period | SMA current | SMA prev | SMA prev2 | | 5 day SMA | 101.07 | 98.86 | 96.83 | | 12 day SMA | 95.07 | 93.65 | 92.17 | | 20 day SMA | 92.67 | 91.8 | 91.16 | | 35 day SMA | 94.7 | 94.46 | 94.22 | | 50 day SMA | 93.58 | 93.16 | 92.79 | | 100 day SMA | 91.48 | 91.29 | 91.11 | | 150 day SMA | 85.14 | 84.83 | 84.54 | | 200 day SMA | 79.59 | 79.43 | 79.26 |
|
|
