EdisonInternational EIX full analysis,charts,indicators,moving averages,SMA,DMA,EMA,ADX,MACD,RSIEdison International EIX WideScreen charts, DMA,SMA,EMA technical analysis, forecast prediction, by indicators ADX,MACD,RSI,CCI NYSE stock exchange
operates under Public Utilities sector & deals in Electric Utilities Central
Daily price and charts and targets EdisonInternational Strong Daily Stock price targets for EdisonInternational EIX are 57.8 and 58.59 | Daily Target 1 | 57.17 | | Daily Target 2 | 57.63 | | Daily Target 3 | 57.96 | | Daily Target 4 | 58.42 | | Daily Target 5 | 58.75 |
Daily price and volume Edison International
| Date |
Closing |
Open |
Range |
Volume |
Fri 05 December 2025 |
58.09 (0.94%) |
57.59 |
57.50 - 58.29 |
0.8875 times |
Thu 04 December 2025 |
57.55 (0.44%) |
57.35 |
56.94 - 58.33 |
0.762 times |
Wed 03 December 2025 |
57.30 (0.28%) |
57.35 |
56.73 - 57.96 |
0.8271 times |
Tue 02 December 2025 |
57.14 (-1.7%) |
58.47 |
57.12 - 58.54 |
1.0873 times |
Mon 01 December 2025 |
58.13 (-1.29%) |
58.85 |
57.95 - 59.14 |
0.8719 times |
Fri 28 November 2025 |
58.89 (-0.37%) |
59.29 |
58.77 - 59.47 |
0.3739 times |
Wed 26 November 2025 |
59.11 (1.04%) |
59.09 |
58.80 - 59.81 |
0.7791 times |
Tue 25 November 2025 |
58.50 (-1.15%) |
59.45 |
58.43 - 59.79 |
0.8021 times |
Mon 24 November 2025 |
59.18 (1.02%) |
59.00 |
57.99 - 59.36 |
2.0025 times |
Fri 21 November 2025 |
58.58 (0.86%) |
58.72 |
58.30 - 59.77 |
1.6067 times |
Thu 20 November 2025 |
58.08 (1.01%) |
58.03 |
57.83 - 59.73 |
1.4142 times |
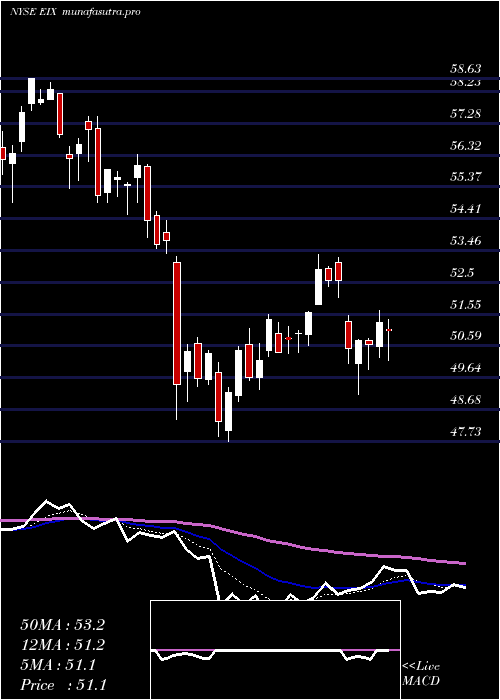
Weekly price and charts EdisonInternational Strong weekly Stock price targets for EdisonInternational EIX are 56.21 and 58.62 | Weekly Target 1 | 55.58 | | Weekly Target 2 | 56.83 | | Weekly Target 3 | 57.986666666667 | | Weekly Target 4 | 59.24 | | Weekly Target 5 | 60.4 |
Weekly price and volumes for Edison International
| Date |
Closing |
Open |
Range |
Volume |
Fri 05 December 2025 |
58.09 (-1.36%) |
58.85 |
56.73 - 59.14 |
1.1855 times |
Fri 28 November 2025 |
58.89 (0.53%) |
59.00 |
57.99 - 59.81 |
1.0577 times |
Fri 21 November 2025 |
58.58 (-0.22%) |
58.06 |
56.86 - 59.77 |
1.5217 times |
Fri 14 November 2025 |
58.71 (2.93%) |
57.15 |
56.73 - 59.34 |
0.9351 times |
Fri 07 November 2025 |
57.04 (3%) |
54.26 |
53.41 - 57.30 |
0.844 times |
Fri 31 October 2025 |
55.38 (0%) |
55.45 |
54.60 - 55.61 |
0.359 times |
Fri 31 October 2025 |
55.38 (-4.2%) |
57.04 |
54.20 - 57.79 |
1.4892 times |
Fri 24 October 2025 |
57.81 (2.03%) |
57.18 |
56.72 - 58.81 |
0.9387 times |
Fri 17 October 2025 |
56.66 (5.53%) |
52.16 |
52.00 - 58.07 |
1.1122 times |
Tue 07 October 2025 |
53.69 (-3%) |
55.56 |
52.55 - 55.90 |
0.5569 times |
Fri 03 October 2025 |
55.35 (0.62%) |
55.18 |
53.49 - 56.51 |
1.2977 times |
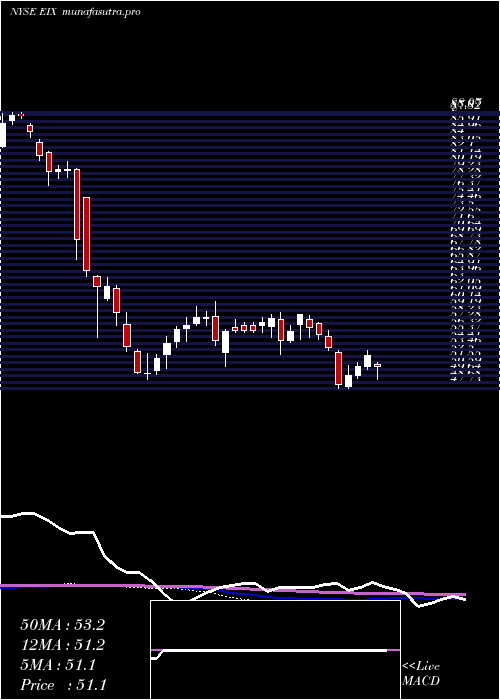
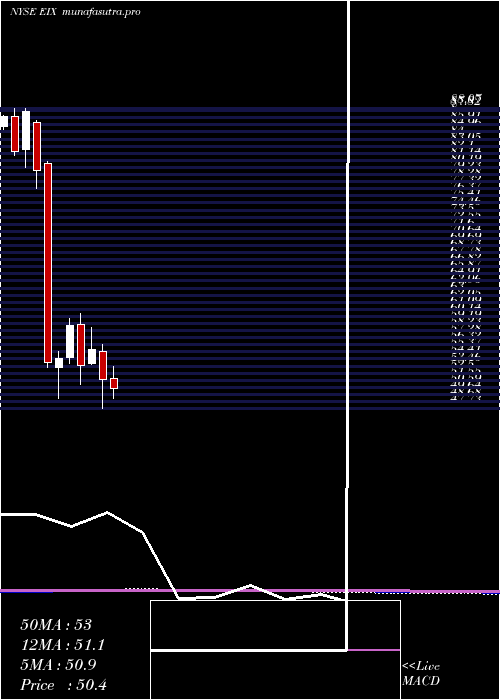
Monthly price and charts EdisonInternational Strong monthly Stock price targets for EdisonInternational EIX are 56.21 and 58.62 | Monthly Target 1 | 55.58 | | Monthly Target 2 | 56.83 | | Monthly Target 3 | 57.986666666667 | | Monthly Target 4 | 59.24 | | Monthly Target 5 | 60.4 |
Monthly price and volumes Edison International
| Date |
Closing |
Open |
Range |
Volume |
Fri 05 December 2025 |
58.09 (-1.36%) |
58.85 |
56.73 - 59.14 |
0.2218 times |
Fri 28 November 2025 |
58.89 (6.34%) |
54.26 |
53.41 - 59.81 |
0.8155 times |
Fri 31 October 2025 |
55.38 (0.18%) |
55.47 |
52.00 - 58.81 |
0.983 times |
Tue 30 September 2025 |
55.28 (-1.51%) |
55.51 |
52.96 - 57.36 |
1.1183 times |
Fri 29 August 2025 |
56.13 (7.69%) |
52.20 |
51.40 - 57.62 |
1.0144 times |
Thu 31 July 2025 |
52.12 (1.01%) |
51.83 |
49.14 - 53.35 |
1.3166 times |
Mon 30 June 2025 |
51.60 (-7.28%) |
55.42 |
47.73 - 56.33 |
1.3634 times |
Fri 30 May 2025 |
55.65 (4%) |
53.75 |
53.66 - 58.63 |
0.8407 times |
Wed 30 April 2025 |
53.51 (-9.18%) |
59.04 |
51.00 - 60.49 |
1.0119 times |
Mon 31 March 2025 |
58.92 (8.23%) |
54.65 |
53.81 - 59.84 |
1.3144 times |
Fri 28 February 2025 |
54.44 (0.81%) |
53.24 |
49.06 - 55.39 |
1.647 times |
DMA SMA EMA moving averages of Edison International EIX
DMA (daily moving average) of Edison International EIX
| DMA period | DMA value | | 5 day DMA | 57.64 | | 12 day DMA | 58.17 | | 20 day DMA | 58.15 | | 35 day DMA | 57.5 | | 50 day DMA | 56.81 | | 100 day DMA | 55.52 | | 150 day DMA | 54.9 | | 200 day DMA | 55.15 | EMA (exponential moving average) of Edison International EIX
| EMA period | EMA current | EMA prev | EMA prev2 | | 5 day EMA | 57.86 | 57.74 | 57.83 | | 12 day EMA | 57.98 | 57.96 | 58.03 | | 20 day EMA | 57.84 | 57.81 | 57.84 | | 35 day EMA | 57.41 | 57.37 | 57.36 | | 50 day EMA | 56.76 | 56.71 | 56.68 |
SMA (simple moving average) of Edison International EIX
| SMA period | SMA current | SMA prev | SMA prev2 | | 5 day SMA | 57.64 | 57.8 | 58.11 | | 12 day SMA | 58.17 | 58.2 | 58.22 | | 20 day SMA | 58.15 | 58.08 | 58.04 | | 35 day SMA | 57.5 | 57.47 | 57.44 | | 50 day SMA | 56.81 | 56.73 | 56.69 | | 100 day SMA | 55.52 | 55.45 | 55.39 | | 150 day SMA | 54.9 | 54.9 | 54.9 | | 200 day SMA | 55.15 | 55.12 | 55.1 |
|
|
