EaglePoint EIC full analysis,charts,indicators,moving averages,SMA,DMA,EMA,ADX,MACD,RSIEagle Point EIC WideScreen charts, DMA,SMA,EMA technical analysis, forecast prediction, by indicators ADX,MACD,RSI,CCI NYSE stock exchange
Daily price and charts and targets EaglePoint Strong Daily Stock price targets for EaglePoint EIC are 11.16 and 11.37 | Daily Target 1 | 11.11 | | Daily Target 2 | 11.21 | | Daily Target 3 | 11.323333333333 | | Daily Target 4 | 11.42 | | Daily Target 5 | 11.53 |
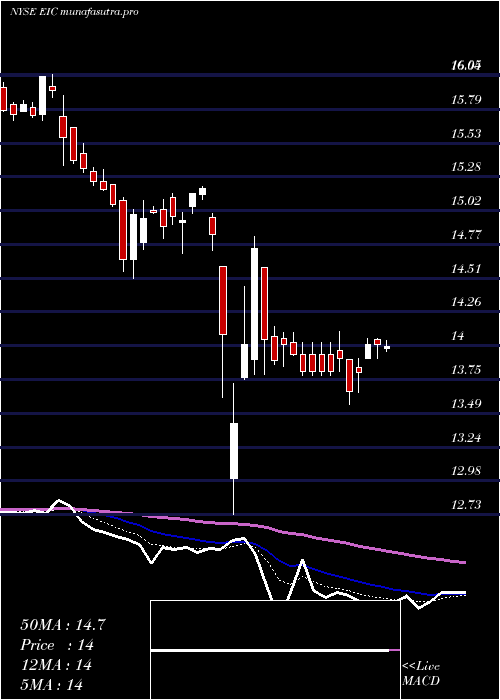
Daily price and volume Eagle Point
| Date |
Closing |
Open |
Range |
Volume |
Fri 05 December 2025 |
11.30 (-0.26%) |
11.37 |
11.23 - 11.44 |
0.693 times |
Thu 04 December 2025 |
11.33 (-0.35%) |
11.37 |
11.28 - 11.43 |
0.9029 times |
Wed 03 December 2025 |
11.37 (0.09%) |
11.32 |
11.28 - 11.52 |
1.1442 times |
Tue 02 December 2025 |
11.36 (-0.61%) |
11.45 |
11.32 - 11.60 |
1.1723 times |
Mon 01 December 2025 |
11.43 (-1.47%) |
11.50 |
11.27 - 11.54 |
1.0253 times |
Fri 28 November 2025 |
11.60 (-0.17%) |
11.60 |
11.58 - 11.77 |
0.7366 times |
Wed 26 November 2025 |
11.62 (0.26%) |
11.58 |
11.50 - 11.72 |
0.7507 times |
Tue 25 November 2025 |
11.59 (0.35%) |
11.47 |
11.45 - 11.73 |
1.1374 times |
Mon 24 November 2025 |
11.55 (3.59%) |
11.14 |
11.14 - 11.55 |
1.3884 times |
Fri 21 November 2025 |
11.15 (0.27%) |
11.18 |
11.11 - 11.26 |
1.0493 times |
Thu 20 November 2025 |
11.12 (-0.89%) |
11.23 |
11.11 - 11.37 |
1.3384 times |
Weekly price and charts EaglePoint Strong weekly Stock price targets for EaglePoint EIC are 11.08 and 11.45 | Weekly Target 1 | 11.01 | | Weekly Target 2 | 11.15 | | Weekly Target 3 | 11.376666666667 | | Weekly Target 4 | 11.52 | | Weekly Target 5 | 11.75 |
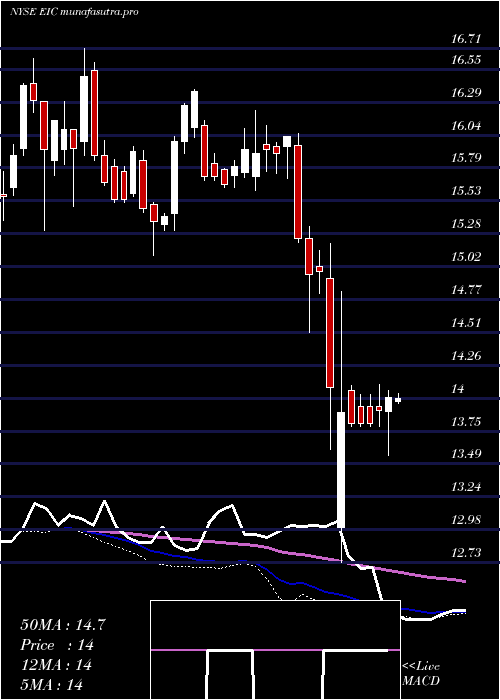
Weekly price and volumes for Eagle Point
| Date |
Closing |
Open |
Range |
Volume |
Fri 05 December 2025 |
11.30 (-2.59%) |
11.50 |
11.23 - 11.60 |
1.3938 times |
Fri 28 November 2025 |
11.60 (4.04%) |
11.14 |
11.14 - 11.77 |
1.1328 times |
Fri 21 November 2025 |
11.15 (-4.78%) |
11.65 |
11.11 - 11.76 |
1.8534 times |
Fri 14 November 2025 |
11.71 (-4.56%) |
12.15 |
11.68 - 12.20 |
1.194 times |
Fri 07 November 2025 |
12.27 (-5.4%) |
12.52 |
12.14 - 12.62 |
0.5712 times |
Fri 31 October 2025 |
12.97 (0%) |
12.85 |
12.80 - 12.98 |
0.1368 times |
Fri 31 October 2025 |
12.97 (2.13%) |
12.74 |
12.61 - 12.98 |
0.6771 times |
Fri 24 October 2025 |
12.70 (4.01%) |
12.20 |
12.13 - 12.74 |
1.1242 times |
Fri 17 October 2025 |
12.21 (-2.32%) |
12.71 |
12.11 - 12.71 |
0.9975 times |
Fri 10 October 2025 |
12.50 (-5.02%) |
13.16 |
12.50 - 13.19 |
0.9191 times |
Fri 03 October 2025 |
13.16 (-0.83%) |
13.28 |
13.15 - 13.55 |
0.85 times |
Monthly price and charts EaglePoint Strong monthly Stock price targets for EaglePoint EIC are 11.08 and 11.45 | Monthly Target 1 | 11.01 | | Monthly Target 2 | 11.15 | | Monthly Target 3 | 11.376666666667 | | Monthly Target 4 | 11.52 | | Monthly Target 5 | 11.75 |
Monthly price and volumes Eagle Point
| Date |
Closing |
Open |
Range |
Volume |
Fri 05 December 2025 |
11.30 (-2.59%) |
11.50 |
11.23 - 11.60 |
0.2257 times |
Fri 28 November 2025 |
11.60 (-10.56%) |
12.52 |
11.11 - 12.62 |
0.7694 times |
Fri 31 October 2025 |
12.97 (-3.64%) |
13.37 |
12.11 - 13.55 |
0.6955 times |
Tue 30 September 2025 |
13.46 (-3.03%) |
13.80 |
13.05 - 13.92 |
0.6276 times |
Fri 29 August 2025 |
13.88 (6.85%) |
12.91 |
12.10 - 13.90 |
1.0164 times |
Thu 31 July 2025 |
12.99 (-4.97%) |
13.75 |
12.46 - 14.05 |
1.5192 times |
Mon 30 June 2025 |
13.67 (2.55%) |
13.34 |
12.63 - 13.84 |
1.3672 times |
Fri 30 May 2025 |
13.33 (-4.79%) |
14.06 |
12.85 - 14.80 |
1.4778 times |
Wed 30 April 2025 |
14.00 (-6.35%) |
15.05 |
12.73 - 15.20 |
1.0665 times |
Mon 31 March 2025 |
14.95 (-5.97%) |
15.95 |
14.51 - 16.05 |
1.2347 times |
Fri 28 February 2025 |
15.90 (0.63%) |
15.75 |
15.61 - 16.23 |
1.0171 times |

DMA SMA EMA moving averages of Eagle Point EIC
DMA (daily moving average) of Eagle Point EIC
| DMA period | DMA value | | 5 day DMA | 11.36 | | 12 day DMA | 11.39 | | 20 day DMA | 11.58 | | 35 day DMA | 11.99 | | 50 day DMA | 12.26 | | 100 day DMA | 12.73 | | 150 day DMA | 13.06 | | 200 day DMA | 13.49 | EMA (exponential moving average) of Eagle Point EIC
| EMA period | EMA current | EMA prev | EMA prev2 | | 5 day EMA | 11.36 | 11.39 | 11.42 | | 12 day EMA | 11.46 | 11.49 | 11.52 | | 20 day EMA | 11.63 | 11.66 | 11.7 | | 35 day EMA | 11.9 | 11.94 | 11.98 | | 50 day EMA | 12.25 | 12.29 | 12.33 |
SMA (simple moving average) of Eagle Point EIC
| SMA period | SMA current | SMA prev | SMA prev2 | | 5 day SMA | 11.36 | 11.42 | 11.48 | | 12 day SMA | 11.39 | 11.39 | 11.4 | | 20 day SMA | 11.58 | 11.63 | 11.68 | | 35 day SMA | 11.99 | 12.02 | 12.05 | | 50 day SMA | 12.26 | 12.3 | 12.34 | | 100 day SMA | 12.73 | 12.75 | 12.78 | | 150 day SMA | 13.06 | 13.08 | 13.09 | | 200 day SMA | 13.49 | 13.52 | 13.54 |
|
|
