VaalcoEnergy EGY full analysis,charts,indicators,moving averages,SMA,DMA,EMA,ADX,MACD,RSIVaalco Energy EGY WideScreen charts, DMA,SMA,EMA technical analysis, forecast prediction, by indicators ADX,MACD,RSI,CCI NYSE stock exchange
operates under Energy sector & deals in Oil Gas Production
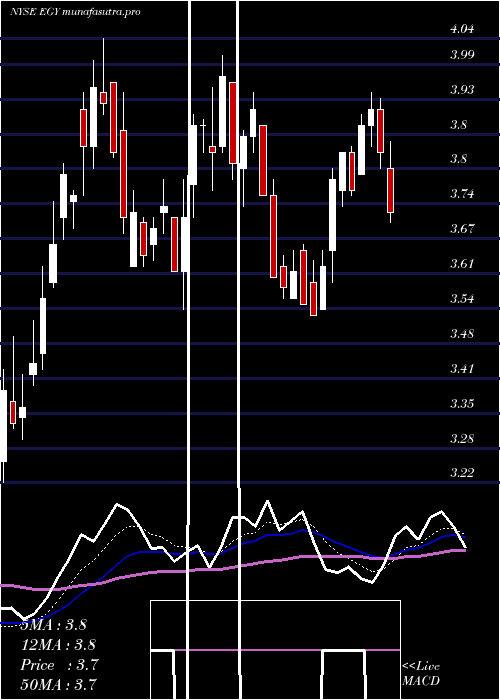
Daily price and charts and targets VaalcoEnergy Strong Daily Stock price targets for VaalcoEnergy EGY are 3.62 and 3.76 | Daily Target 1 | 3.59 | | Daily Target 2 | 3.64 | | Daily Target 3 | 3.73 | | Daily Target 4 | 3.78 | | Daily Target 5 | 3.87 |
Daily price and volume Vaalco Energy
| Date |
Closing |
Open |
Range |
Volume |
Tue 21 October 2025 |
3.69 (-2.12%) |
3.80 |
3.68 - 3.82 |
0.8356 times |
Mon 20 October 2025 |
3.77 (1.62%) |
3.74 |
3.66 - 3.78 |
1.0389 times |
Fri 17 October 2025 |
3.71 (-0.54%) |
3.71 |
3.62 - 3.76 |
0.9975 times |
Thu 16 October 2025 |
3.73 (-2.61%) |
3.83 |
3.68 - 3.86 |
1.1776 times |
Wed 15 October 2025 |
3.83 (0.26%) |
3.85 |
3.79 - 3.92 |
1.0872 times |
Tue 14 October 2025 |
3.82 (-1.04%) |
3.76 |
3.75 - 3.84 |
1.1163 times |
Mon 13 October 2025 |
3.86 (2.93%) |
3.85 |
3.79 - 3.89 |
0.9543 times |
Fri 10 October 2025 |
3.75 (-4.34%) |
3.87 |
3.75 - 3.90 |
1.1531 times |
Thu 09 October 2025 |
3.92 (-2.49%) |
4.01 |
3.91 - 4.08 |
0.8727 times |
Wed 08 October 2025 |
4.02 (-0.74%) |
4.06 |
3.97 - 4.06 |
0.7668 times |
Tue 07 October 2025 |
4.05 (-0.74%) |
4.09 |
4.00 - 4.11 |
0.6546 times |
Weekly price and charts VaalcoEnergy Strong weekly Stock price targets for VaalcoEnergy EGY are 3.6 and 3.76 | Weekly Target 1 | 3.56 | | Weekly Target 2 | 3.63 | | Weekly Target 3 | 3.7233333333333 | | Weekly Target 4 | 3.79 | | Weekly Target 5 | 3.88 |
Weekly price and volumes for Vaalco Energy
| Date |
Closing |
Open |
Range |
Volume |
Tue 21 October 2025 |
3.69 (-0.54%) |
3.74 |
3.66 - 3.82 |
0.4439 times |
Fri 17 October 2025 |
3.71 (-1.07%) |
3.85 |
3.62 - 3.92 |
1.263 times |
Fri 10 October 2025 |
3.75 (-6.48%) |
4.11 |
3.75 - 4.15 |
1.0051 times |
Fri 03 October 2025 |
4.01 (-5.65%) |
4.24 |
3.87 - 4.25 |
1.2443 times |
Fri 26 September 2025 |
4.25 (2.66%) |
4.14 |
4.08 - 4.40 |
1.204 times |
Fri 19 September 2025 |
4.14 (2.99%) |
4.03 |
3.95 - 4.35 |
1.4856 times |
Fri 12 September 2025 |
4.02 (4.96%) |
3.84 |
3.78 - 4.11 |
1.1186 times |
Fri 05 September 2025 |
3.83 (-1.29%) |
3.87 |
3.78 - 3.96 |
0.9175 times |
Fri 29 August 2025 |
3.88 (0%) |
3.91 |
3.87 - 3.96 |
0.1884 times |
Fri 29 August 2025 |
3.88 (-2.02%) |
3.94 |
3.77 - 3.98 |
1.1295 times |
Fri 22 August 2025 |
3.96 (7.03%) |
3.70 |
3.62 - 4.00 |
1.5564 times |

Monthly price and charts VaalcoEnergy Strong monthly Stock price targets for VaalcoEnergy EGY are 3.39 and 3.92 | Monthly Target 1 | 3.29 | | Monthly Target 2 | 3.49 | | Monthly Target 3 | 3.82 | | Monthly Target 4 | 4.02 | | Monthly Target 5 | 4.35 |
Monthly price and volumes Vaalco Energy
| Date |
Closing |
Open |
Range |
Volume |
Tue 21 October 2025 |
3.69 (-8.21%) |
3.98 |
3.62 - 4.15 |
0.5651 times |
Tue 30 September 2025 |
4.02 (3.61%) |
3.87 |
3.78 - 4.40 |
0.871 times |
Fri 29 August 2025 |
3.88 (4.3%) |
3.70 |
3.54 - 4.00 |
1.0154 times |
Thu 31 July 2025 |
3.72 (3.05%) |
3.61 |
3.53 - 4.01 |
0.9944 times |
Mon 30 June 2025 |
3.61 (13.88%) |
3.20 |
3.19 - 4.04 |
1.1161 times |
Fri 30 May 2025 |
3.17 (-3.06%) |
3.27 |
3.14 - 3.88 |
1.2651 times |
Wed 30 April 2025 |
3.27 (-13.03%) |
3.75 |
3.00 - 3.85 |
1.069 times |
Mon 31 March 2025 |
3.76 (-6%) |
4.05 |
3.57 - 4.41 |
1.2964 times |
Fri 28 February 2025 |
4.00 (-2.44%) |
4.10 |
3.83 - 4.49 |
0.7429 times |
Fri 31 January 2025 |
4.10 (-6.18%) |
4.50 |
4.05 - 4.82 |
1.0646 times |
Tue 31 December 2024 |
4.37 (-14.65%) |
5.21 |
4.15 - 5.25 |
1.0105 times |

DMA SMA EMA moving averages of Vaalco Energy EGY
DMA (daily moving average) of Vaalco Energy EGY
| DMA period | DMA value | | 5 day DMA | 3.75 | | 12 day DMA | 3.85 | | 20 day DMA | 3.95 | | 35 day DMA | 3.99 | | 50 day DMA | 3.94 | | 100 day DMA | 3.81 | | 150 day DMA | 3.69 | | 200 day DMA | 3.83 | EMA (exponential moving average) of Vaalco Energy EGY
| EMA period | EMA current | EMA prev | EMA prev2 | | 5 day EMA | 3.75 | 3.78 | 3.78 | | 12 day EMA | 3.83 | 3.86 | 3.88 | | 20 day EMA | 3.89 | 3.91 | 3.93 | | 35 day EMA | 3.9 | 3.91 | 3.92 | | 50 day EMA | 3.89 | 3.9 | 3.91 |
SMA (simple moving average) of Vaalco Energy EGY
| SMA period | SMA current | SMA prev | SMA prev2 | | 5 day SMA | 3.75 | 3.77 | 3.79 | | 12 day SMA | 3.85 | 3.88 | 3.89 | | 20 day SMA | 3.95 | 3.98 | 4 | | 35 day SMA | 3.99 | 4 | 4 | | 50 day SMA | 3.94 | 3.94 | 3.94 | | 100 day SMA | 3.81 | 3.81 | 3.8 | | 150 day SMA | 3.69 | 3.7 | 3.7 | | 200 day SMA | 3.83 | 3.83 | 3.83 |
|
|
