EmeraldExpositions EEX full analysis,charts,indicators,moving averages,SMA,DMA,EMA,ADX,MACD,RSIEmerald Expositions EEX WideScreen charts, DMA,SMA,EMA technical analysis, forecast prediction, by indicators ADX,MACD,RSI,CCI NYSE stock exchange
operates under Miscellaneous sector & deals in Business Services
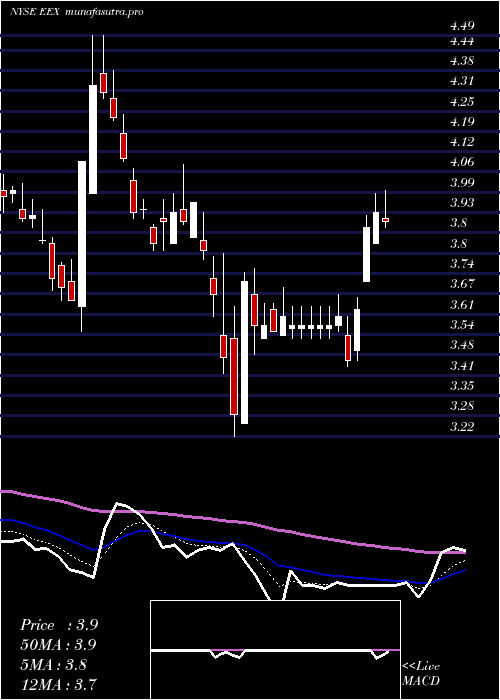
Daily price and charts and targets EmeraldExpositions Strong Daily Stock price targets for EmeraldExpositions EEX are 3.72 and 3.86 | Daily Target 1 | 3.6 | | Daily Target 2 | 3.69 | | Daily Target 3 | 3.74 | | Daily Target 4 | 3.83 | | Daily Target 5 | 3.88 |
Daily price and volume Emerald Expositions
| Date |
Closing |
Open |
Range |
Volume |
Thu 04 December 2025 |
3.78 (-0.26%) |
3.74 |
3.65 - 3.79 |
1.6902 times |
Wed 03 December 2025 |
3.79 (8.29%) |
3.51 |
3.51 - 3.79 |
2.6748 times |
Tue 02 December 2025 |
3.50 (3.86%) |
3.37 |
3.33 - 3.52 |
1.8116 times |
Mon 01 December 2025 |
3.37 (-7.92%) |
3.59 |
3.32 - 3.67 |
0.5218 times |
Fri 28 November 2025 |
3.66 (3.39%) |
3.57 |
3.54 - 3.66 |
0.1904 times |
Wed 26 November 2025 |
3.54 (-1.67%) |
3.57 |
3.49 - 3.62 |
0.5579 times |
Tue 25 November 2025 |
3.60 (-1.1%) |
3.67 |
3.55 - 3.77 |
0.7286 times |
Mon 24 November 2025 |
3.64 (-7.85%) |
3.94 |
3.58 - 3.94 |
0.6859 times |
Fri 21 November 2025 |
3.95 (5.9%) |
3.76 |
3.76 - 3.97 |
0.8533 times |
Thu 20 November 2025 |
3.73 (-2.36%) |
3.86 |
3.72 - 4.04 |
0.2855 times |
Wed 19 November 2025 |
3.82 (-1.29%) |
3.87 |
3.78 - 3.95 |
0.3085 times |
Weekly price and charts EmeraldExpositions Strong weekly Stock price targets for EmeraldExpositions EEX are 3.55 and 4.02 | Weekly Target 1 | 3.16 | | Weekly Target 2 | 3.47 | | Weekly Target 3 | 3.63 | | Weekly Target 4 | 3.94 | | Weekly Target 5 | 4.1 |
Weekly price and volumes for Emerald Expositions
| Date |
Closing |
Open |
Range |
Volume |
Thu 04 December 2025 |
3.78 (3.28%) |
3.59 |
3.32 - 3.79 |
1.907 times |
Fri 28 November 2025 |
3.66 (-7.34%) |
3.94 |
3.49 - 3.94 |
0.6157 times |
Fri 21 November 2025 |
3.95 (-1.25%) |
3.99 |
3.72 - 4.04 |
0.6242 times |
Fri 14 November 2025 |
4.00 (0.25%) |
4.02 |
3.95 - 4.18 |
0.8909 times |
Fri 07 November 2025 |
3.99 (-9.11%) |
4.22 |
3.96 - 4.33 |
1.0544 times |
Fri 31 October 2025 |
4.39 (0%) |
3.69 |
3.69 - 4.52 |
0.3326 times |
Fri 31 October 2025 |
4.39 (-6.6%) |
4.72 |
3.69 - 4.92 |
1.0413 times |
Fri 24 October 2025 |
4.70 (-2.89%) |
4.87 |
4.57 - 5.00 |
1.3833 times |
Fri 17 October 2025 |
4.84 (1.26%) |
4.84 |
4.71 - 4.93 |
1.3095 times |
Fri 10 October 2025 |
4.78 (-2.85%) |
4.95 |
4.74 - 5.00 |
0.8409 times |
Fri 03 October 2025 |
4.92 (-3.91%) |
5.10 |
4.84 - 5.28 |
0.7695 times |
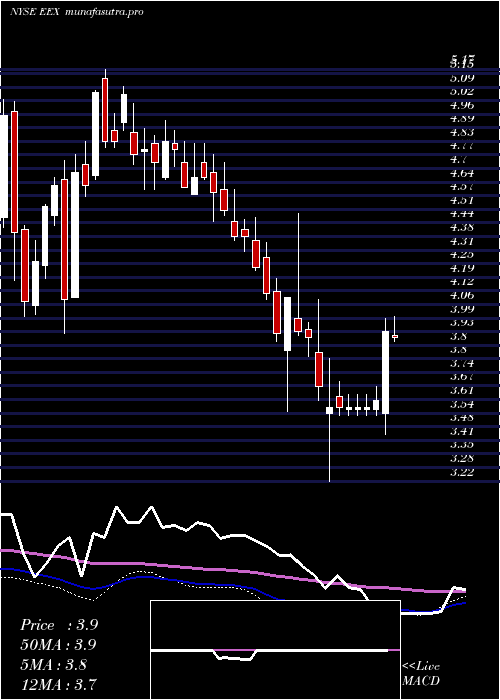
Monthly price and charts EmeraldExpositions Strong monthly Stock price targets for EmeraldExpositions EEX are 3.55 and 4.02 | Monthly Target 1 | 3.16 | | Monthly Target 2 | 3.47 | | Monthly Target 3 | 3.63 | | Monthly Target 4 | 3.94 | | Monthly Target 5 | 4.1 |
Monthly price and volumes Emerald Expositions
| Date |
Closing |
Open |
Range |
Volume |
Thu 04 December 2025 |
3.78 (3.28%) |
3.59 |
3.32 - 3.79 |
0.2683 times |
Fri 28 November 2025 |
3.66 (-16.63%) |
4.22 |
3.49 - 4.33 |
0.4481 times |
Fri 31 October 2025 |
4.39 (-13.75%) |
5.05 |
3.69 - 5.13 |
0.7447 times |
Tue 30 September 2025 |
5.09 (-1.17%) |
5.04 |
4.80 - 5.45 |
0.7475 times |
Fri 29 August 2025 |
5.15 (3.62%) |
4.91 |
4.60 - 5.35 |
0.5368 times |
Thu 31 July 2025 |
4.97 (2.47%) |
4.80 |
4.77 - 5.38 |
0.8086 times |
Mon 30 June 2025 |
4.85 (5.9%) |
4.56 |
4.52 - 5.00 |
1.4031 times |
Fri 30 May 2025 |
4.58 (16.54%) |
4.25 |
4.25 - 4.87 |
1.5498 times |
Wed 30 April 2025 |
3.93 (0%) |
3.94 |
3.22 - 4.08 |
1.4761 times |
Mon 31 March 2025 |
3.93 (-4.38%) |
4.12 |
3.55 - 4.49 |
2.0169 times |
Fri 28 February 2025 |
4.11 (-8.67%) |
4.45 |
4.08 - 4.60 |
1.9828 times |

DMA SMA EMA moving averages of Emerald Expositions EEX
DMA (daily moving average) of Emerald Expositions EEX
| DMA period | DMA value | | 5 day DMA | 3.62 | | 12 day DMA | 3.69 | | 20 day DMA | 3.81 | | 35 day DMA | 4.14 | | 50 day DMA | 4.38 | | 100 day DMA | 4.71 | | 150 day DMA | 4.73 | | 200 day DMA | 4.51 | EMA (exponential moving average) of Emerald Expositions EEX
| EMA period | EMA current | EMA prev | EMA prev2 | | 5 day EMA | 3.68 | 3.63 | 3.55 | | 12 day EMA | 3.72 | 3.71 | 3.69 | | 20 day EMA | 3.83 | 3.84 | 3.85 | | 35 day EMA | 4.09 | 4.11 | 4.13 | | 50 day EMA | 4.38 | 4.4 | 4.42 |
SMA (simple moving average) of Emerald Expositions EEX
| SMA period | SMA current | SMA prev | SMA prev2 | | 5 day SMA | 3.62 | 3.57 | 3.53 | | 12 day SMA | 3.69 | 3.69 | 3.71 | | 20 day SMA | 3.81 | 3.83 | 3.84 | | 35 day SMA | 4.14 | 4.17 | 4.2 | | 50 day SMA | 4.38 | 4.41 | 4.43 | | 100 day SMA | 4.71 | 4.72 | 4.73 | | 150 day SMA | 4.73 | 4.73 | 4.74 | | 200 day SMA | 4.51 | 4.52 | 4.52 |
|
|
