MorganStanley EDD full analysis,charts,indicators,moving averages,SMA,DMA,EMA,ADX,MACD,RSIMorgan Stanley EDD WideScreen charts, DMA,SMA,EMA technical analysis, forecast prediction, by indicators ADX,MACD,RSI,CCI NYSE stock exchange
operates under N A sector & deals in N A
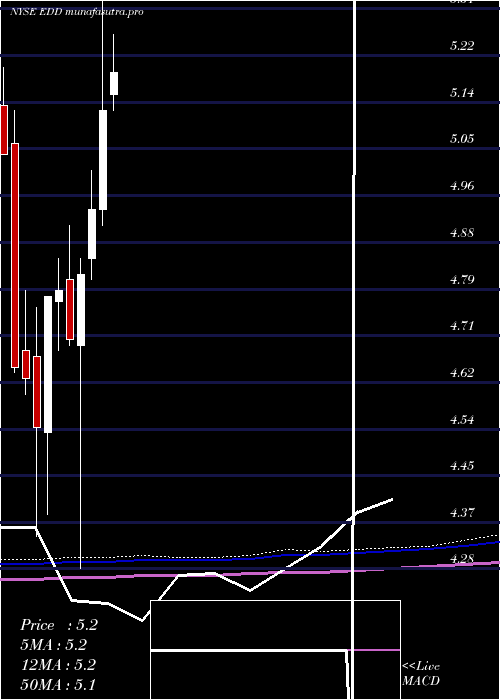
Daily price and charts and targets MorganStanley Strong Daily Stock price targets for MorganStanley EDD are 5.31 and 5.45 | Daily Target 1 | 5.19 | | Daily Target 2 | 5.29 | | Daily Target 3 | 5.3333333333333 | | Daily Target 4 | 5.43 | | Daily Target 5 | 5.47 |
Daily price and volume Morgan Stanley
| Date |
Closing |
Open |
Range |
Volume |
Tue 21 October 2025 |
5.38 (2.28%) |
5.27 |
5.24 - 5.38 |
0.9064 times |
Mon 20 October 2025 |
5.26 (1.54%) |
5.22 |
5.20 - 5.26 |
0.9658 times |
Fri 17 October 2025 |
5.18 (-0.77%) |
5.21 |
5.12 - 5.21 |
1.3342 times |
Thu 16 October 2025 |
5.22 (-1.14%) |
5.29 |
5.16 - 5.29 |
1.8287 times |
Wed 15 October 2025 |
5.28 (0%) |
5.32 |
5.27 - 5.34 |
1.3795 times |
Tue 14 October 2025 |
5.28 (-0.38%) |
5.30 |
5.25 - 5.30 |
0.7927 times |
Mon 13 October 2025 |
5.30 (0%) |
5.34 |
5.25 - 5.34 |
0.6454 times |
Fri 10 October 2025 |
5.30 (-0.75%) |
5.34 |
5.28 - 5.34 |
0.4945 times |
Thu 09 October 2025 |
5.34 (-0.19%) |
5.34 |
5.28 - 5.35 |
0.7544 times |
Wed 08 October 2025 |
5.35 (0.56%) |
5.33 |
5.30 - 5.37 |
0.8983 times |
Tue 07 October 2025 |
5.32 (0.76%) |
5.29 |
5.26 - 5.33 |
1.0954 times |
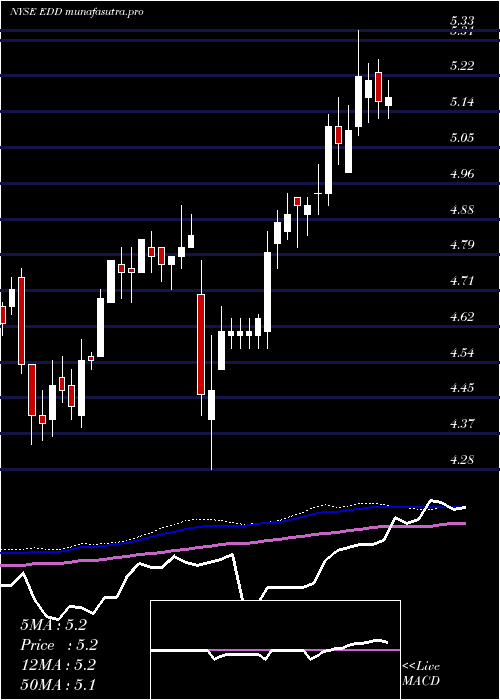
Weekly price and charts MorganStanley Strong weekly Stock price targets for MorganStanley EDD are 5.29 and 5.47 | Weekly Target 1 | 5.14 | | Weekly Target 2 | 5.26 | | Weekly Target 3 | 5.32 | | Weekly Target 4 | 5.44 | | Weekly Target 5 | 5.5 |
Weekly price and volumes for Morgan Stanley
| Date |
Closing |
Open |
Range |
Volume |
Tue 21 October 2025 |
5.38 (3.86%) |
5.22 |
5.20 - 5.38 |
0.4715 times |
Fri 17 October 2025 |
5.18 (-2.26%) |
5.34 |
5.12 - 5.34 |
1.5062 times |
Fri 10 October 2025 |
5.30 (-0.19%) |
5.31 |
5.25 - 5.37 |
0.9842 times |
Fri 03 October 2025 |
5.31 (-3.45%) |
5.53 |
5.25 - 5.54 |
1.2185 times |
Fri 26 September 2025 |
5.50 (-3.17%) |
5.68 |
5.47 - 5.68 |
0.9201 times |
Fri 19 September 2025 |
5.68 (7.37%) |
5.30 |
5.29 - 5.69 |
1.3824 times |
Fri 12 September 2025 |
5.29 (-1.49%) |
5.40 |
5.29 - 5.48 |
1.3381 times |
Fri 05 September 2025 |
5.37 (0.94%) |
5.29 |
5.21 - 5.43 |
1.2049 times |
Fri 29 August 2025 |
5.32 (0%) |
5.27 |
5.27 - 5.32 |
0.1321 times |
Fri 29 August 2025 |
5.32 (0%) |
5.31 |
5.24 - 5.32 |
0.8419 times |
Fri 22 August 2025 |
5.32 (-0.19%) |
5.35 |
5.22 - 5.42 |
0.9795 times |
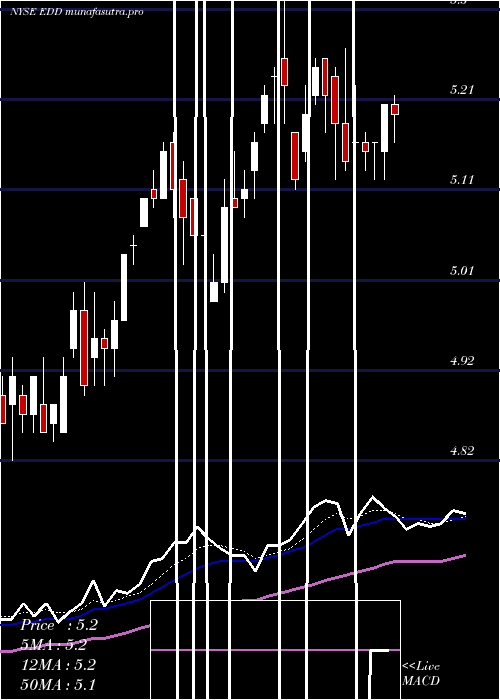
Monthly price and charts MorganStanley Strong monthly Stock price targets for MorganStanley EDD are 5.25 and 5.53 | Monthly Target 1 | 5.02 | | Monthly Target 2 | 5.2 | | Monthly Target 3 | 5.3 | | Monthly Target 4 | 5.48 | | Monthly Target 5 | 5.58 |
Monthly price and volumes Morgan Stanley
| Date |
Closing |
Open |
Range |
Volume |
Tue 21 October 2025 |
5.38 (0%) |
5.37 |
5.12 - 5.40 |
0.961 times |
Tue 30 September 2025 |
5.38 (1.13%) |
5.29 |
5.21 - 5.69 |
1.3233 times |
Fri 29 August 2025 |
5.32 (4.11%) |
5.10 |
5.07 - 5.42 |
0.9493 times |
Thu 31 July 2025 |
5.11 (-0.2%) |
5.15 |
4.96 - 5.26 |
1.7118 times |
Mon 30 June 2025 |
5.12 (3.64%) |
4.94 |
4.91 - 5.33 |
0.8416 times |
Fri 30 May 2025 |
4.94 (2.49%) |
4.85 |
4.81 - 5.01 |
0.8771 times |
Wed 30 April 2025 |
4.82 (2.55%) |
4.69 |
4.28 - 4.85 |
0.9831 times |
Mon 31 March 2025 |
4.70 (-1.88%) |
4.81 |
4.69 - 4.91 |
0.7261 times |
Fri 28 February 2025 |
4.79 (0.21%) |
4.77 |
4.68 - 4.85 |
0.7005 times |
Fri 31 January 2025 |
4.78 (5.29%) |
4.53 |
4.38 - 4.78 |
0.926 times |
Tue 31 December 2024 |
4.54 (-1.94%) |
4.67 |
4.34 - 4.76 |
0.9359 times |
DMA SMA EMA moving averages of Morgan Stanley EDD
DMA (daily moving average) of Morgan Stanley EDD
| DMA period | DMA value | | 5 day DMA | 5.26 | | 12 day DMA | 5.29 | | 20 day DMA | 5.35 | | 35 day DMA | 5.41 | | 50 day DMA | 5.38 | | 100 day DMA | 5.25 | | 150 day DMA | 5.09 | | 200 day DMA | 4.99 | EMA (exponential moving average) of Morgan Stanley EDD
| EMA period | EMA current | EMA prev | EMA prev2 | | 5 day EMA | 5.29 | 5.25 | 5.24 | | 12 day EMA | 5.3 | 5.29 | 5.3 | | 20 day EMA | 5.32 | 5.31 | 5.32 | | 35 day EMA | 5.34 | 5.34 | 5.34 | | 50 day EMA | 5.36 | 5.36 | 5.36 |
SMA (simple moving average) of Morgan Stanley EDD
| SMA period | SMA current | SMA prev | SMA prev2 | | 5 day SMA | 5.26 | 5.24 | 5.25 | | 12 day SMA | 5.29 | 5.29 | 5.29 | | 20 day SMA | 5.35 | 5.36 | 5.38 | | 35 day SMA | 5.41 | 5.4 | 5.41 | | 50 day SMA | 5.38 | 5.38 | 5.38 | | 100 day SMA | 5.25 | 5.25 | 5.25 | | 150 day SMA | 5.09 | 5.08 | 5.08 | | 200 day SMA | 4.99 | 4.99 | 4.98 |
|
|
