BrinkerInternational EAT full analysis,charts,indicators,moving averages,SMA,DMA,EMA,ADX,MACD,RSIBrinker International EAT WideScreen charts, DMA,SMA,EMA technical analysis, forecast prediction, by indicators ADX,MACD,RSI,CCI NYSE stock exchange
operates under Consumer Services sector & deals in Restaurants
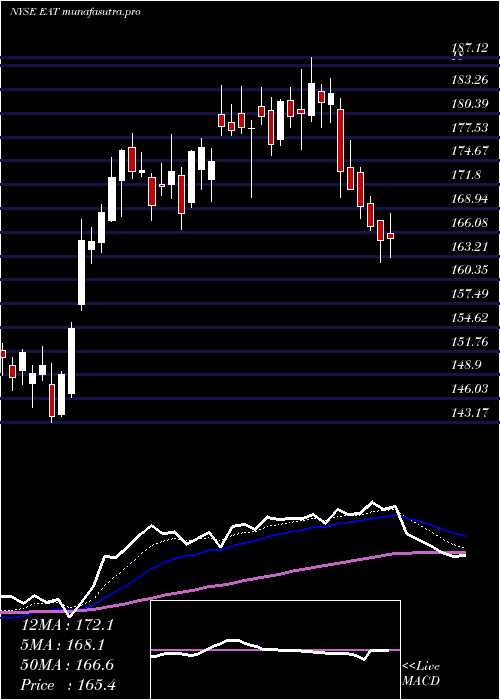
Daily price and charts and targets BrinkerInternational Strong Daily Stock price targets for BrinkerInternational EAT are 137.94 and 142.06 | Daily Target 1 | 137.1 | | Daily Target 2 | 138.77 | | Daily Target 3 | 141.21666666667 | | Daily Target 4 | 142.89 | | Daily Target 5 | 145.34 |
Daily price and volume Brinker International
| Date |
Closing |
Open |
Range |
Volume |
Fri 05 December 2025 |
140.45 (-1.26%) |
143.63 |
139.54 - 143.66 |
0.6969 times |
Thu 04 December 2025 |
142.24 (0.12%) |
142.41 |
138.32 - 145.45 |
1.0758 times |
Wed 03 December 2025 |
142.07 (-4.67%) |
149.05 |
140.91 - 150.00 |
1.2741 times |
Tue 02 December 2025 |
149.03 (-1.55%) |
152.24 |
147.47 - 153.60 |
0.9201 times |
Mon 01 December 2025 |
151.37 (-1.57%) |
152.12 |
150.55 - 154.42 |
0.9672 times |
Fri 28 November 2025 |
153.79 (1.33%) |
152.00 |
151.46 - 155.18 |
0.4735 times |
Wed 26 November 2025 |
151.77 (1.38%) |
150.00 |
149.05 - 154.84 |
0.5209 times |
Tue 25 November 2025 |
149.71 (6.71%) |
146.01 |
145.45 - 153.05 |
1.6305 times |
Mon 24 November 2025 |
140.29 (3.95%) |
137.00 |
136.48 - 142.20 |
1.3093 times |
Fri 21 November 2025 |
134.96 (6.16%) |
127.83 |
127.81 - 136.51 |
1.1317 times |
Thu 20 November 2025 |
127.13 (-0.63%) |
128.00 |
126.67 - 131.88 |
1.0865 times |
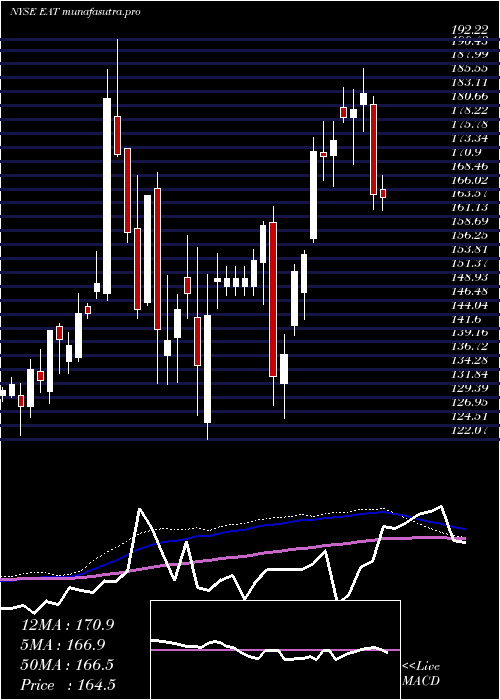
Weekly price and charts BrinkerInternational Strong weekly Stock price targets for BrinkerInternational EAT are 131.34 and 147.44 | Weekly Target 1 | 128.3 | | Weekly Target 2 | 134.37 | | Weekly Target 3 | 144.39666666667 | | Weekly Target 4 | 150.47 | | Weekly Target 5 | 160.5 |
Weekly price and volumes for Brinker International
| Date |
Closing |
Open |
Range |
Volume |
Fri 05 December 2025 |
140.45 (-8.67%) |
152.12 |
138.32 - 154.42 |
1.0629 times |
Fri 28 November 2025 |
153.79 (13.95%) |
137.00 |
136.48 - 155.18 |
0.8476 times |
Fri 21 November 2025 |
134.96 (19.23%) |
114.73 |
114.73 - 136.51 |
1.4247 times |
Fri 14 November 2025 |
113.19 (10.28%) |
103.38 |
102.92 - 117.58 |
1.2421 times |
Fri 07 November 2025 |
102.64 (-5.54%) |
105.05 |
100.30 - 106.34 |
0.9188 times |
Fri 31 October 2025 |
108.66 (0%) |
107.17 |
107.00 - 110.21 |
0.2104 times |
Fri 31 October 2025 |
108.66 (-14.65%) |
128.23 |
107.00 - 129.00 |
1.9255 times |
Fri 24 October 2025 |
127.31 (-0.42%) |
128.37 |
124.00 - 133.62 |
0.7186 times |
Fri 17 October 2025 |
127.85 (2.39%) |
125.54 |
125.54 - 133.51 |
0.8675 times |
Fri 10 October 2025 |
124.86 (-1.37%) |
128.00 |
121.23 - 133.00 |
0.782 times |
Fri 03 October 2025 |
126.59 (-4.24%) |
134.87 |
124.27 - 134.87 |
0.9926 times |
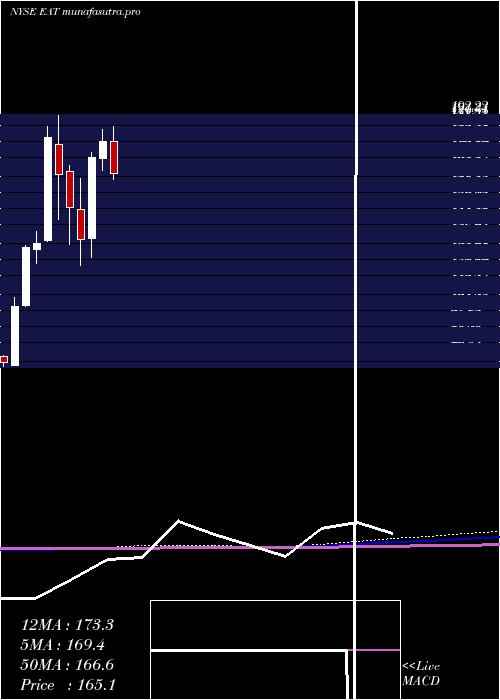
Monthly price and charts BrinkerInternational Strong monthly Stock price targets for BrinkerInternational EAT are 131.34 and 147.44 | Monthly Target 1 | 128.3 | | Monthly Target 2 | 134.37 | | Monthly Target 3 | 144.39666666667 | | Monthly Target 4 | 150.47 | | Monthly Target 5 | 160.5 |
Monthly price and volumes Brinker International
| Date |
Closing |
Open |
Range |
Volume |
Fri 05 December 2025 |
140.45 (-8.67%) |
152.12 |
138.32 - 154.42 |
0.2709 times |
Fri 28 November 2025 |
153.79 (41.53%) |
105.05 |
100.30 - 155.18 |
1.1297 times |
Fri 31 October 2025 |
108.66 (-14.22%) |
126.85 |
107.00 - 133.62 |
1.2766 times |
Tue 30 September 2025 |
126.68 (-18.78%) |
154.17 |
124.89 - 171.14 |
0.999 times |
Fri 29 August 2025 |
155.98 (-1.03%) |
154.00 |
149.06 - 167.79 |
1.0026 times |
Thu 31 July 2025 |
157.60 (-12.6%) |
180.16 |
151.35 - 187.12 |
0.9939 times |
Mon 30 June 2025 |
180.33 (4.46%) |
172.36 |
166.38 - 185.70 |
0.929 times |
Fri 30 May 2025 |
172.63 (28.54%) |
134.74 |
125.78 - 175.13 |
1.1132 times |
Wed 30 April 2025 |
134.30 (-9.9%) |
148.16 |
122.07 - 162.92 |
1.3487 times |
Mon 31 March 2025 |
149.05 (-9.57%) |
166.18 |
131.78 - 168.90 |
0.9364 times |
Fri 28 February 2025 |
164.83 (-9.42%) |
178.72 |
143.35 - 192.22 |
1.0372 times |
DMA SMA EMA moving averages of Brinker International EAT
DMA (daily moving average) of Brinker International EAT
| DMA period | DMA value | | 5 day DMA | 145.03 | | 12 day DMA | 142.56 | | 20 day DMA | 130.66 | | 35 day DMA | 125.46 | | 50 day DMA | 126.15 | | 100 day DMA | 140.09 | | 150 day DMA | 148.13 | | 200 day DMA | 147.91 | EMA (exponential moving average) of Brinker International EAT
| EMA period | EMA current | EMA prev | EMA prev2 | | 5 day EMA | 143.4 | 144.87 | 146.19 | | 12 day EMA | 140.12 | 140.06 | 139.66 | | 20 day EMA | 135.32 | 134.78 | 134 | | 35 day EMA | 132.04 | 131.55 | 130.92 | | 50 day EMA | 128.85 | 128.38 | 127.81 |
SMA (simple moving average) of Brinker International EAT
| SMA period | SMA current | SMA prev | SMA prev2 | | 5 day SMA | 145.03 | 147.7 | 149.61 | | 12 day SMA | 142.56 | 141.04 | 139.28 | | 20 day SMA | 130.66 | 128.75 | 126.82 | | 35 day SMA | 125.46 | 125.12 | 124.79 | | 50 day SMA | 126.15 | 126 | 125.9 | | 100 day SMA | 140.09 | 140.35 | 140.57 | | 150 day SMA | 148.13 | 148.06 | 148.01 | | 200 day SMA | 147.91 | 147.97 | 148.07 |
|
|
