EllingtonResidential EARN full analysis,charts,indicators,moving averages,SMA,DMA,EMA,ADX,MACD,RSIEllington Residential EARN WideScreen charts, DMA,SMA,EMA technical analysis, forecast prediction, by indicators ADX,MACD,RSI,CCI NYSE stock exchange
operates under Consumer Services sector & deals in Real Estate Investment Trusts
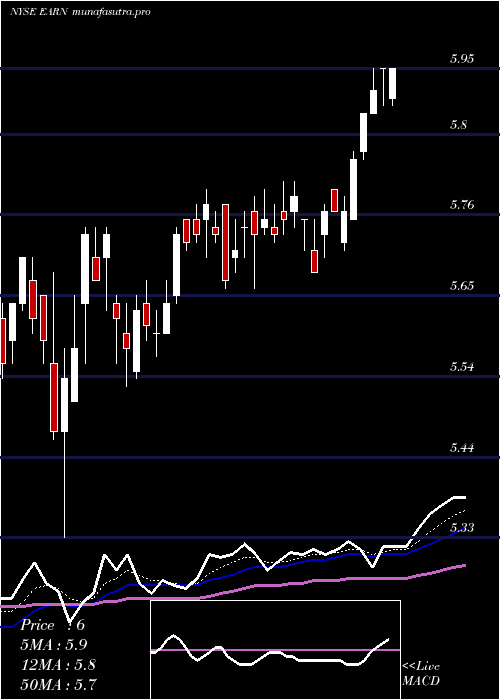
Daily price and charts and targets EllingtonResidential Strong Daily Stock price targets for EllingtonResidential EARN are 5.23 and 5.33 | Daily Target 1 | 5.15 | | Daily Target 2 | 5.2 | | Daily Target 3 | 5.2533333333333 | | Daily Target 4 | 5.3 | | Daily Target 5 | 5.35 |
Daily price and volume Ellington Residential
| Date |
Closing |
Open |
Range |
Volume |
Tue 21 October 2025 |
5.24 (0.77%) |
5.21 |
5.21 - 5.31 |
0.9088 times |
Mon 20 October 2025 |
5.20 (1.17%) |
5.14 |
5.14 - 5.23 |
0.8789 times |
Fri 17 October 2025 |
5.14 (0.19%) |
5.10 |
5.10 - 5.15 |
0.6726 times |
Thu 16 October 2025 |
5.13 (0.39%) |
5.12 |
5.12 - 5.20 |
0.8737 times |
Wed 15 October 2025 |
5.11 (1.19%) |
5.06 |
5.06 - 5.12 |
0.8068 times |
Tue 14 October 2025 |
5.05 (-1.56%) |
5.01 |
5.01 - 5.10 |
1.552 times |
Mon 13 October 2025 |
5.13 (2.19%) |
5.06 |
5.04 - 5.13 |
0.8547 times |
Fri 10 October 2025 |
5.02 (-2.14%) |
5.13 |
5.01 - 5.17 |
1.4004 times |
Thu 09 October 2025 |
5.13 (-0.97%) |
5.15 |
5.11 - 5.18 |
0.9905 times |
Wed 08 October 2025 |
5.18 (0.58%) |
5.15 |
5.11 - 5.20 |
1.0616 times |
Tue 07 October 2025 |
5.15 (-1.72%) |
5.23 |
5.13 - 5.23 |
1.6619 times |
Weekly price and charts EllingtonResidential Strong weekly Stock price targets for EllingtonResidential EARN are 5.19 and 5.36 | Weekly Target 1 | 5.06 | | Weekly Target 2 | 5.15 | | Weekly Target 3 | 5.23 | | Weekly Target 4 | 5.32 | | Weekly Target 5 | 5.4 |
Weekly price and volumes for Ellington Residential
| Date |
Closing |
Open |
Range |
Volume |
Tue 21 October 2025 |
5.24 (1.95%) |
5.14 |
5.14 - 5.31 |
0.4529 times |
Fri 17 October 2025 |
5.14 (2.39%) |
5.06 |
5.01 - 5.20 |
1.2059 times |
Fri 10 October 2025 |
5.02 (-7.89%) |
5.50 |
5.01 - 5.55 |
1.6158 times |
Fri 03 October 2025 |
5.45 (-4.39%) |
5.72 |
5.27 - 5.73 |
1.6877 times |
Fri 26 September 2025 |
5.70 (0%) |
5.69 |
5.59 - 5.74 |
0.8616 times |
Fri 19 September 2025 |
5.70 (1.06%) |
5.67 |
5.64 - 5.76 |
0.6435 times |
Fri 12 September 2025 |
5.64 (0%) |
5.61 |
5.61 - 5.71 |
0.7907 times |
Fri 05 September 2025 |
5.64 (-1.23%) |
5.66 |
5.56 - 5.75 |
1.0409 times |
Fri 29 August 2025 |
5.71 (0%) |
5.79 |
5.71 - 5.82 |
0.4224 times |
Fri 29 August 2025 |
5.71 (-2.23%) |
5.80 |
5.71 - 5.89 |
1.2786 times |
Fri 22 August 2025 |
5.84 (3.91%) |
5.60 |
5.57 - 5.89 |
1.4028 times |
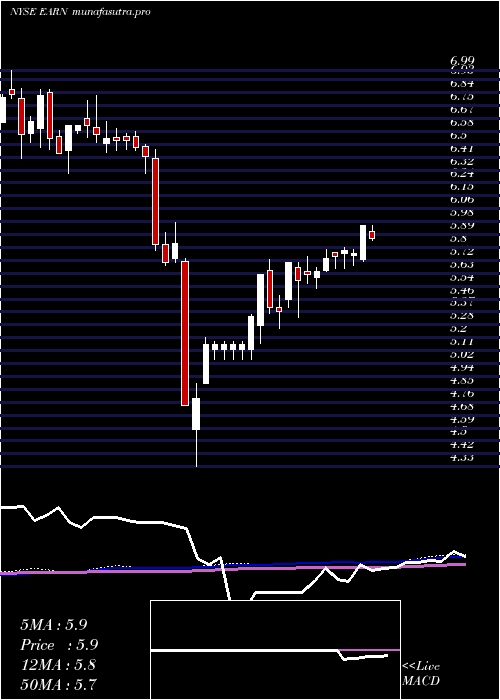
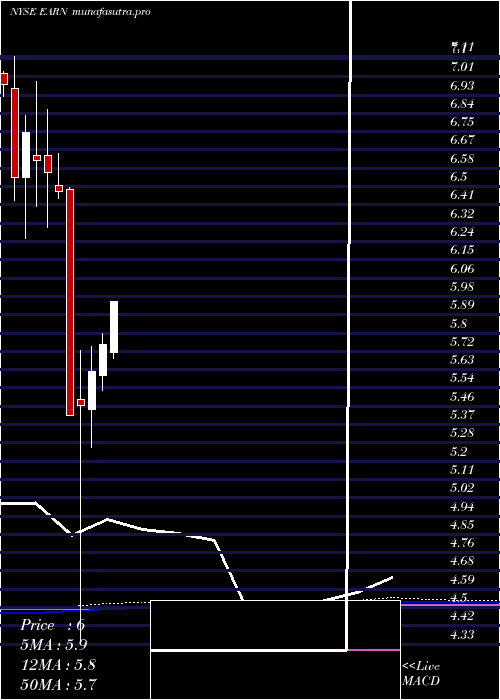
Monthly price and charts EllingtonResidential Strong monthly Stock price targets for EllingtonResidential EARN are 4.86 and 5.4 | Monthly Target 1 | 4.73 | | Monthly Target 2 | 4.98 | | Monthly Target 3 | 5.2666666666667 | | Monthly Target 4 | 5.52 | | Monthly Target 5 | 5.81 |
Monthly price and volumes Ellington Residential
| Date |
Closing |
Open |
Range |
Volume |
Tue 21 October 2025 |
5.24 (-3.85%) |
5.45 |
5.01 - 5.55 |
0.5337 times |
Tue 30 September 2025 |
5.45 (-4.55%) |
5.66 |
5.41 - 5.76 |
0.5163 times |
Fri 29 August 2025 |
5.71 (-2.39%) |
5.82 |
5.55 - 5.89 |
0.8317 times |
Thu 31 July 2025 |
5.85 (1.74%) |
5.71 |
5.68 - 6.08 |
0.6321 times |
Mon 30 June 2025 |
5.75 (2.31%) |
5.60 |
5.53 - 5.80 |
0.4719 times |
Fri 30 May 2025 |
5.62 (2.93%) |
5.44 |
5.26 - 5.74 |
0.7392 times |
Wed 30 April 2025 |
5.46 (0.92%) |
5.49 |
4.33 - 5.72 |
1.8434 times |
Mon 31 March 2025 |
5.41 (-16.38%) |
6.48 |
5.41 - 6.49 |
1.8314 times |
Fri 28 February 2025 |
6.47 (-1.37%) |
6.50 |
6.44 - 6.65 |
1.3339 times |
Fri 31 January 2025 |
6.56 (-0.91%) |
6.64 |
6.30 - 6.86 |
1.2665 times |
Tue 31 December 2024 |
6.62 (-1.93%) |
6.64 |
6.40 - 6.99 |
0.8236 times |
DMA SMA EMA moving averages of Ellington Residential EARN
DMA (daily moving average) of Ellington Residential EARN
| DMA period | DMA value | | 5 day DMA | 5.16 | | 12 day DMA | 5.14 | | 20 day DMA | 5.3 | | 35 day DMA | 5.46 | | 50 day DMA | 5.54 | | 100 day DMA | 5.66 | | 150 day DMA | 5.56 | | 200 day DMA | 5.78 | EMA (exponential moving average) of Ellington Residential EARN
| EMA period | EMA current | EMA prev | EMA prev2 | | 5 day EMA | 5.18 | 5.15 | 5.13 | | 12 day EMA | 5.21 | 5.2 | 5.2 | | 20 day EMA | 5.29 | 5.29 | 5.3 | | 35 day EMA | 5.39 | 5.4 | 5.41 | | 50 day EMA | 5.51 | 5.52 | 5.53 |
SMA (simple moving average) of Ellington Residential EARN
| SMA period | SMA current | SMA prev | SMA prev2 | | 5 day SMA | 5.16 | 5.13 | 5.11 | | 12 day SMA | 5.14 | 5.16 | 5.17 | | 20 day SMA | 5.3 | 5.32 | 5.35 | | 35 day SMA | 5.46 | 5.47 | 5.49 | | 50 day SMA | 5.54 | 5.55 | 5.56 | | 100 day SMA | 5.66 | 5.67 | 5.67 | | 150 day SMA | 5.56 | 5.56 | 5.57 | | 200 day SMA | 5.78 | 5.79 | 5.8 |
|
|
