BlackrockDebt DSU full analysis,charts,indicators,moving averages,SMA,DMA,EMA,ADX,MACD,RSIBlackrock Debt DSU WideScreen charts, DMA,SMA,EMA technical analysis, forecast prediction, by indicators ADX,MACD,RSI,CCI NYSE stock exchange
operates under N A sector & deals in N A
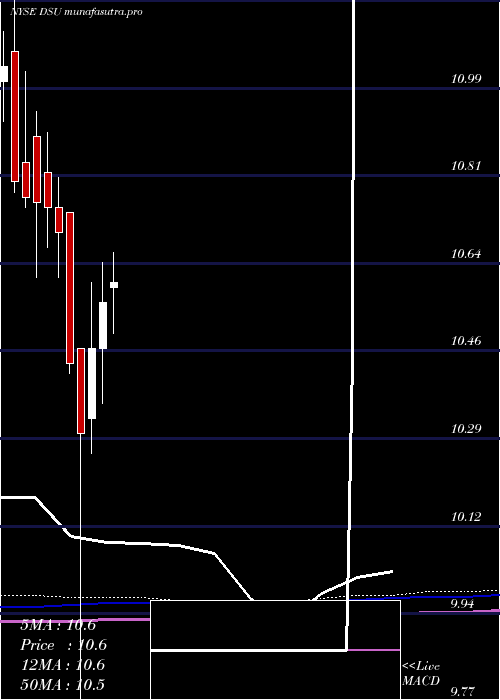
Daily price and charts and targets BlackrockDebt Strong Daily Stock price targets for BlackrockDebt DSU are 10.25 and 10.31 | Daily Target 1 | 10.23 | | Daily Target 2 | 10.27 | | Daily Target 3 | 10.293333333333 | | Daily Target 4 | 10.33 | | Daily Target 5 | 10.35 |
Daily price and volume Blackrock Debt
| Date |
Closing |
Open |
Range |
Volume |
Thu 04 December 2025 |
10.30 (-0.1%) |
10.31 |
10.26 - 10.32 |
0.782 times |
Wed 03 December 2025 |
10.31 (0.49%) |
10.26 |
10.22 - 10.32 |
0.987 times |
Tue 02 December 2025 |
10.26 (0%) |
10.29 |
10.23 - 10.30 |
1.0444 times |
Mon 01 December 2025 |
10.26 (-0.39%) |
10.25 |
10.22 - 10.31 |
0.7123 times |
Fri 28 November 2025 |
10.30 (0.1%) |
10.32 |
10.26 - 10.34 |
1.0238 times |
Wed 26 November 2025 |
10.29 (-0.1%) |
10.27 |
10.24 - 10.29 |
1.2823 times |
Tue 25 November 2025 |
10.30 (0.98%) |
10.24 |
10.22 - 10.32 |
1.1473 times |
Mon 24 November 2025 |
10.20 (-0.2%) |
10.24 |
10.20 - 10.25 |
0.7828 times |
Fri 21 November 2025 |
10.22 (1.09%) |
10.16 |
10.12 - 10.22 |
1.0019 times |
Thu 20 November 2025 |
10.11 (-1.17%) |
10.23 |
10.11 - 10.23 |
1.2363 times |
Wed 19 November 2025 |
10.23 (0.39%) |
10.19 |
10.16 - 10.23 |
0.7609 times |
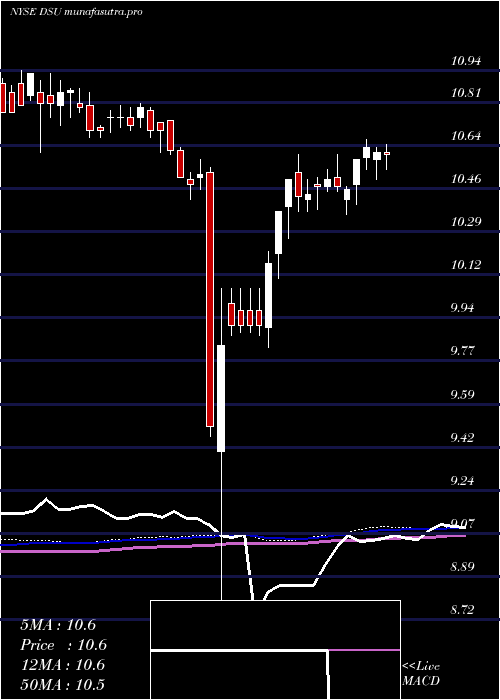
Weekly price and charts BlackrockDebt Strong weekly Stock price targets for BlackrockDebt DSU are 10.26 and 10.36 | Weekly Target 1 | 10.18 | | Weekly Target 2 | 10.24 | | Weekly Target 3 | 10.28 | | Weekly Target 4 | 10.34 | | Weekly Target 5 | 10.38 |
Weekly price and volumes for Blackrock Debt
| Date |
Closing |
Open |
Range |
Volume |
Thu 04 December 2025 |
10.30 (0%) |
10.25 |
10.22 - 10.32 |
0.7584 times |
Fri 28 November 2025 |
10.30 (0.78%) |
10.24 |
10.20 - 10.34 |
0.9113 times |
Fri 21 November 2025 |
10.22 (0.1%) |
10.20 |
10.11 - 10.23 |
0.9593 times |
Fri 14 November 2025 |
10.21 (-0.87%) |
10.34 |
10.18 - 10.37 |
0.7638 times |
Fri 07 November 2025 |
10.30 (-0.29%) |
10.34 |
10.24 - 10.39 |
0.6674 times |
Fri 31 October 2025 |
10.33 (0%) |
10.36 |
10.31 - 10.36 |
0.2977 times |
Fri 31 October 2025 |
10.33 (0.39%) |
10.34 |
10.29 - 10.38 |
1.0874 times |
Fri 24 October 2025 |
10.29 (1.38%) |
10.18 |
10.13 - 10.32 |
1.0907 times |
Fri 17 October 2025 |
10.15 (-1.26%) |
10.30 |
10.07 - 10.43 |
1.5019 times |
Fri 10 October 2025 |
10.28 (-2.1%) |
10.50 |
10.27 - 10.54 |
1.9622 times |
Fri 03 October 2025 |
10.50 (-0.1%) |
10.51 |
10.47 - 10.67 |
2.2737 times |
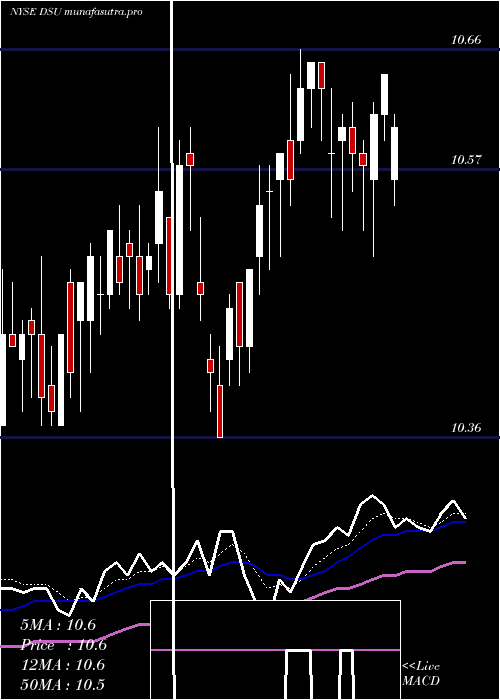
Monthly price and charts BlackrockDebt Strong monthly Stock price targets for BlackrockDebt DSU are 10.26 and 10.36 | Monthly Target 1 | 10.18 | | Monthly Target 2 | 10.24 | | Monthly Target 3 | 10.28 | | Monthly Target 4 | 10.34 | | Monthly Target 5 | 10.38 |
Monthly price and volumes Blackrock Debt
| Date |
Closing |
Open |
Range |
Volume |
Thu 04 December 2025 |
10.30 (0%) |
10.25 |
10.22 - 10.32 |
0.1637 times |
Fri 28 November 2025 |
10.30 (-0.29%) |
10.34 |
10.11 - 10.39 |
0.7128 times |
Fri 31 October 2025 |
10.33 (-2.73%) |
10.60 |
10.07 - 10.67 |
1.5697 times |
Tue 30 September 2025 |
10.62 (0%) |
10.52 |
10.47 - 10.65 |
1.2591 times |
Fri 29 August 2025 |
10.62 (0.47%) |
10.56 |
10.43 - 10.62 |
1.1105 times |
Thu 31 July 2025 |
10.57 (0.09%) |
10.59 |
10.46 - 10.66 |
1.3396 times |
Mon 30 June 2025 |
10.56 (0.86%) |
10.47 |
10.36 - 10.64 |
0.8171 times |
Fri 30 May 2025 |
10.47 (1.65%) |
10.33 |
10.26 - 10.60 |
0.7515 times |
Wed 30 April 2025 |
10.30 (-1.34%) |
10.47 |
8.72 - 10.47 |
1.4529 times |
Mon 31 March 2025 |
10.44 (-2.43%) |
10.74 |
10.42 - 10.74 |
0.823 times |
Fri 28 February 2025 |
10.70 (-0.47%) |
10.75 |
10.61 - 10.81 |
0.9936 times |
DMA SMA EMA moving averages of Blackrock Debt DSU
DMA (daily moving average) of Blackrock Debt DSU
| DMA period | DMA value | | 5 day DMA | 10.29 | | 12 day DMA | 10.25 | | 20 day DMA | 10.27 | | 35 day DMA | 10.27 | | 50 day DMA | 10.33 | | 100 day DMA | 10.45 | | 150 day DMA | 10.46 | | 200 day DMA | 10.42 | EMA (exponential moving average) of Blackrock Debt DSU
| EMA period | EMA current | EMA prev | EMA prev2 | | 5 day EMA | 10.29 | 10.28 | 10.27 | | 12 day EMA | 10.27 | 10.27 | 10.26 | | 20 day EMA | 10.26 | 10.26 | 10.26 | | 35 day EMA | 10.31 | 10.31 | 10.31 | | 50 day EMA | 10.36 | 10.36 | 10.36 |
SMA (simple moving average) of Blackrock Debt DSU
| SMA period | SMA current | SMA prev | SMA prev2 | | 5 day SMA | 10.29 | 10.28 | 10.28 | | 12 day SMA | 10.25 | 10.24 | 10.23 | | 20 day SMA | 10.27 | 10.27 | 10.27 | | 35 day SMA | 10.27 | 10.27 | 10.27 | | 50 day SMA | 10.33 | 10.34 | 10.34 | | 100 day SMA | 10.45 | 10.45 | 10.45 | | 150 day SMA | 10.46 | 10.46 | 10.46 | | 200 day SMA | 10.42 | 10.42 | 10.43 |
|
|
