DoverCorporation DOV full analysis,charts,indicators,moving averages,SMA,DMA,EMA,ADX,MACD,RSIDover Corporation DOV WideScreen charts, DMA,SMA,EMA technical analysis, forecast prediction, by indicators ADX,MACD,RSI,CCI NYSE stock exchange
operates under Technology sector & deals in Industrial Machinery Components
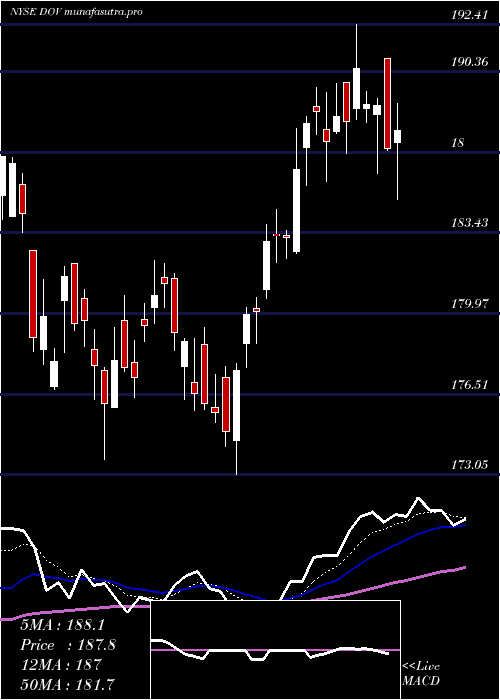
Daily price and charts and targets DoverCorporation Strong Daily Stock price targets for DoverCorporation DOV are 170.67 and 176.01 | Daily Target 1 | 166.31 | | Daily Target 2 | 169.68 | | Daily Target 3 | 171.65333333333 | | Daily Target 4 | 175.02 | | Daily Target 5 | 176.99 |
Daily price and volume Dover Corporation
| Date |
Closing |
Open |
Range |
Volume |
Tue 21 October 2025 |
173.04 (2.44%) |
168.29 |
168.29 - 173.63 |
1.0364 times |
Mon 20 October 2025 |
168.92 (1.45%) |
167.65 |
166.93 - 169.35 |
0.831 times |
Fri 17 October 2025 |
166.50 (0.22%) |
165.35 |
164.73 - 166.59 |
2.0807 times |
Thu 16 October 2025 |
166.13 (2.13%) |
163.52 |
163.33 - 166.37 |
1.3877 times |
Wed 15 October 2025 |
162.66 (0.07%) |
164.80 |
161.28 - 164.99 |
0.7475 times |
Tue 14 October 2025 |
162.55 (0.86%) |
159.18 |
158.97 - 163.67 |
0.7804 times |
Mon 13 October 2025 |
161.16 (-0.18%) |
163.85 |
161.16 - 163.85 |
0.8467 times |
Fri 10 October 2025 |
161.45 (-0.52%) |
163.21 |
160.40 - 164.06 |
1.1995 times |
Thu 09 October 2025 |
162.30 (-1.49%) |
165.41 |
162.05 - 165.45 |
0.5928 times |
Wed 08 October 2025 |
164.75 (0.1%) |
165.41 |
163.72 - 166.00 |
0.4972 times |
Tue 07 October 2025 |
164.59 (-1.16%) |
167.30 |
164.22 - 167.34 |
0.5887 times |
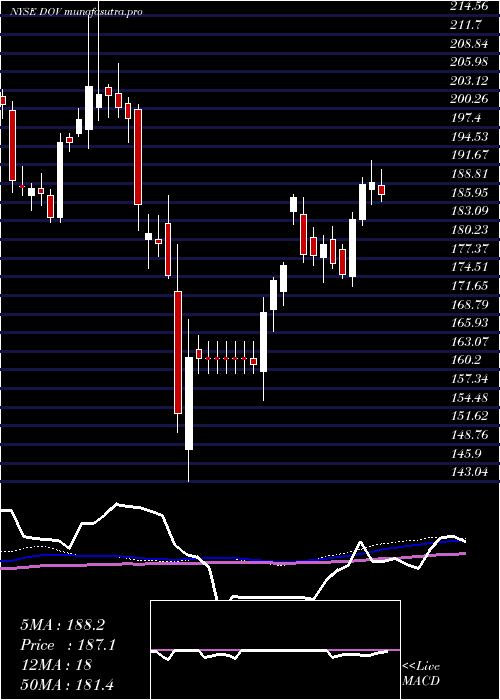
Weekly price and charts DoverCorporation Strong weekly Stock price targets for DoverCorporation DOV are 169.99 and 176.69 | Weekly Target 1 | 164.5 | | Weekly Target 2 | 168.77 | | Weekly Target 3 | 171.2 | | Weekly Target 4 | 175.47 | | Weekly Target 5 | 177.9 |
Weekly price and volumes for Dover Corporation
| Date |
Closing |
Open |
Range |
Volume |
Tue 21 October 2025 |
173.04 (3.93%) |
167.65 |
166.93 - 173.63 |
0.6135 times |
Fri 17 October 2025 |
166.50 (3.13%) |
163.85 |
158.97 - 166.59 |
1.9196 times |
Fri 10 October 2025 |
161.45 (-3.1%) |
167.68 |
160.40 - 167.75 |
1.0699 times |
Fri 03 October 2025 |
166.61 (-0.82%) |
168.98 |
164.62 - 169.01 |
1.0563 times |
Fri 26 September 2025 |
167.99 (-1.96%) |
170.35 |
163.70 - 172.26 |
1.2704 times |
Fri 19 September 2025 |
171.34 (-0.95%) |
173.11 |
170.38 - 175.81 |
1.1093 times |
Fri 12 September 2025 |
172.98 (-2.68%) |
177.77 |
172.88 - 178.63 |
1.1593 times |
Fri 05 September 2025 |
177.75 (-0.62%) |
176.70 |
173.96 - 180.48 |
0.8197 times |
Fri 29 August 2025 |
178.86 (0%) |
180.90 |
178.65 - 181.57 |
0.1164 times |
Fri 29 August 2025 |
178.86 (-2.3%) |
183.26 |
178.65 - 183.68 |
0.8655 times |
Fri 22 August 2025 |
183.07 (3.7%) |
176.42 |
175.71 - 183.84 |
1.1052 times |
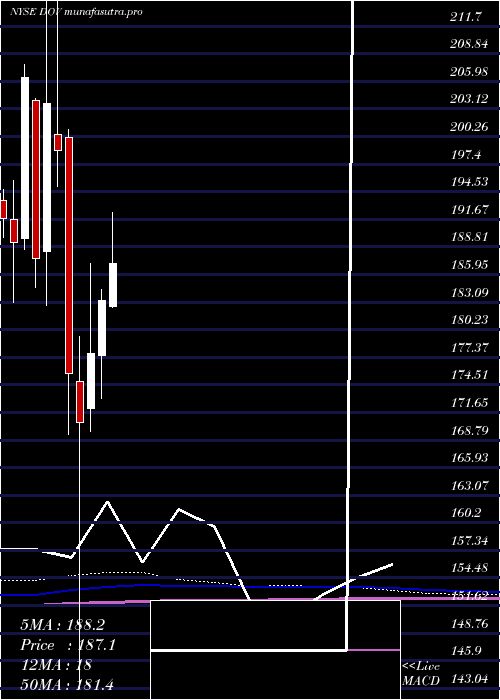
Monthly price and charts DoverCorporation Strong monthly Stock price targets for DoverCorporation DOV are 166.01 and 180.67 | Monthly Target 1 | 153.89 | | Monthly Target 2 | 163.46 | | Monthly Target 3 | 168.54666666667 | | Monthly Target 4 | 178.12 | | Monthly Target 5 | 183.21 |
Monthly price and volumes Dover Corporation
| Date |
Closing |
Open |
Range |
Volume |
Tue 21 October 2025 |
173.04 (3.72%) |
165.40 |
158.97 - 173.63 |
0.8351 times |
Tue 30 September 2025 |
166.83 (-6.73%) |
176.70 |
163.70 - 180.48 |
1.0088 times |
Fri 29 August 2025 |
178.86 (-1.26%) |
178.05 |
173.30 - 183.84 |
0.9053 times |
Thu 31 July 2025 |
181.14 (-1.14%) |
182.65 |
180.68 - 195.23 |
1.2171 times |
Mon 30 June 2025 |
183.23 (3.08%) |
177.53 |
173.05 - 184.43 |
0.8523 times |
Fri 30 May 2025 |
177.75 (4.16%) |
172.04 |
169.68 - 187.14 |
0.9775 times |
Wed 30 April 2025 |
170.65 (-2.86%) |
174.89 |
143.04 - 179.50 |
1.5093 times |
Mon 31 March 2025 |
175.68 (-11.62%) |
200.18 |
169.40 - 200.98 |
1.0433 times |
Fri 28 February 2025 |
198.77 (-2.41%) |
200.52 |
195.10 - 222.31 |
0.7089 times |
Fri 31 January 2025 |
203.68 (8.57%) |
188.32 |
182.75 - 214.57 |
0.9423 times |
Tue 31 December 2024 |
187.60 (-9.08%) |
204.00 |
184.63 - 204.24 |
0.5579 times |
DMA SMA EMA moving averages of Dover Corporation DOV
DMA (daily moving average) of Dover Corporation DOV
| DMA period | DMA value | | 5 day DMA | 167.45 | | 12 day DMA | 165.05 | | 20 day DMA | 165.73 | | 35 day DMA | 169.27 | | 50 day DMA | 172.39 | | 100 day DMA | 177.25 | | 150 day DMA | 175.21 | | 200 day DMA | 180 | EMA (exponential moving average) of Dover Corporation DOV
| EMA period | EMA current | EMA prev | EMA prev2 | | 5 day EMA | 168.42 | 166.11 | 164.71 | | 12 day EMA | 166.64 | 165.48 | 164.86 | | 20 day EMA | 167.08 | 166.45 | 166.19 | | 35 day EMA | 169.22 | 169 | 169.01 | | 50 day EMA | 172.16 | 172.12 | 172.25 |
SMA (simple moving average) of Dover Corporation DOV
| SMA period | SMA current | SMA prev | SMA prev2 | | 5 day SMA | 167.45 | 165.35 | 163.8 | | 12 day SMA | 165.05 | 164.51 | 164.33 | | 20 day SMA | 165.73 | 165.54 | 165.6 | | 35 day SMA | 169.27 | 169.34 | 169.63 | | 50 day SMA | 172.39 | 172.49 | 172.62 | | 100 day SMA | 177.25 | 177.31 | 177.44 | | 150 day SMA | 175.21 | 175.26 | 175.35 | | 200 day SMA | 180 | 180.07 | 180.17 |
|
|
